Destinations › Africa · The Destination Index · universal template · every figure sourced
Namibia.
Southern Africa, bordering the South Atlantic Ocean, between Angola and South Africa. 824,292 sq km and 3,092,816 people, 1,572 km of coastline, desert; hot, dry; rainfall sparse and erratic.
Region · AfricaPopulation · ~3,092,816Languages · Oshiwambo languages, Nama and Damara, Kavango languages, Afrikaans, Otjiherero, English (official)Eco Index · 65/100 · Passable
The Eco Index across 12 pillars · scored 0 to 5 · World Bank, OWID, WHO/UNICEF JMP, FiBL, Protected Planet, IUCN, UNESCO (2023-24)
Water
Food & farming
Plant-based
Organic
Conservation
Wildlife
Materials
Pollution
Recycling
Energy
Culture
Heritage
The History of Namibia.
Namibia's ancestral traditions remain strong. In Ovaherero and Ovambanderu homesteads life centres on Okuruuo, the holy fire where the ancestors and the creator are believed to reside, while the Nama keep alive their ancestral music and the Nama≠Nāb dancing steps, which UNESCO placed on its urgent safeguarding list in 2020.
Where the name comes from
The country's name comes from the word nama, meaning 'vast place', which was used for the Namib Desert, according to the Namibia Press Agency. Under German rule the territory was Deutsch-Südwestafrika, or South-West Africa, and it became the Republic of Namibia when it gained independence on 21 March 1990.
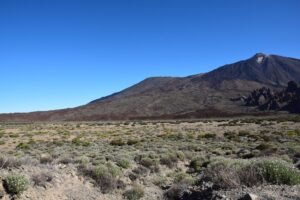
The land itself: a high plateau through the middle, the Namib along the coast, the Kalahari to the east. Its high point is Königstein on the Brandberg, 2,573 m. Source: national mapping and survey records.
Where it starts
The earliest known figurative art in Africa
Seven painted stone plaques of micaceous shale schist were excavated from the Apollo 11 Cave in 1969 and 1972. They come from a single layer at the interface between the final Middle Stone Age and the earliest Later Stone Age. Radiocarbon ages of 28,000 to 26,000 years were first reported for that level, and later AMS radiocarbon and luminescence dating places it at about 30,000 years ago, making these the earliest known figurative art in Africa. Older abstract engravings on ochre are known from Blombos Cave in South Africa. Across Namibia, more than 1,200 rock art sites belong mostly to the hunter-gatherer tradition generally attributed to San people and their ancestors.
How it got here
Genocide, then occupation, then independence
Germany claimed the territory in 1884. Between 1904 and 1908 German colonial forces carried out the extermination of Herero and Nama people, recognised as the first genocide of the twentieth century. South Africa took over the territory in 1915 and governed it under a League of Nations mandate from 1920. SWAPO launched an armed struggle in 1966, and after UN-supervised elections in 1989 Namibia became independent on 21 March 1990.
The timeline
About 30,000 years ago
The Apollo 11 Cave stones.
Seven painted stone plaques, recovered by the archaeologist Wolfgang Erich Wendt in 1969 and 1972. They come from a single layer dated by radiocarbon and luminescence methods to about 30,000 years ago, and are the only African figurative art known from that period. The artists used black pigments from manganese and charcoal and red pigments probably made from ochre-rich shale. Older abstract engravings on ochre are known from Blombos Cave in South Africa. ↗
From about 6,000 years ago
San presence.
Namibia has more than 1,200 rock art sites across the country. Most belong to the hunter-gatherer tradition of southern Africa, which is generally attributed to San people and their ancestors, and painting in the region began as much as 6,000 years ago. ↗
About 1,200 years ago onward
Farming and herding.
Bantu-speaking farmers and herders, together with Khoekhoe pastoralists, probably began to enter Namibia about 1,200 years ago. ↗
1884
German colonisation.
Germany claims the territory as German South West Africa in 1884. The colonial war against the Herero and Nama from 1904 is now widely recognised as the first genocide of the twentieth century. ↗
1904 to 1908
The Herero and Nama genocide.
German colonial forces carried out the extermination of Herero and Nama people. It is recognised as the first genocide of the twentieth century. ↗
1915 to 1990
South African rule.
South Africa takes over the territory during the First World War and rules it until independence, from 1920 under a League of Nations mandate. ↗
1966 to 1989
The liberation war.
SWAPO launches an armed struggle against South African occupation in 1966. South Africa agrees to Namibian independence in 1988, and UN-supervised elections follow in 1989. ↗
1990
Independence.
Namibia becomes independent on 21 March 1990, ending South African rule, and joins the United Nations a month later. ↗
About 39.9% of the land is protected (World Bank, 2024), and Namibia was the first African country to write environmental protection into its constitution and pioneered communal conservancies that place a further large area under community conservation. Enforcement supports custodianship of the largest free-roaming black rhino population, while marine cover is about 1.71% of territorial waters.
Is wild Namibia protected? 39.9% of the land is, already past the 30% target for 2030
How protected is nature in Namibia?
Forest cover9.8%
Terrestrial protected area39.9%
Marine protected area1.71%
144 (mammals, birds, fish & plants) listed as threatened.
Critically Endangered, the last IUCN category before Extinct in the Wild, and still recorded in Namibia. GBIF holds 70 verified occurrence records.
Gyps africanus
Critically Endangered, the last IUCN category before Extinct in the Wild, and still recorded in Namibia. GBIF holds 423 verified occurrence records.
Crassothonna opima
Critically Endangered, the last IUCN category before Extinct in the Wild, and still recorded in Namibia. GBIF holds 5 verified occurrence records.
Aloe pearsonii
Critically Endangered, the last IUCN category before Extinct in the Wild, and still recorded in Namibia. GBIF holds 3 verified occurrence records.
Species named here are drawn from GBIF occurrence records for Namibia filtered to the IUCN Red List threatened categories. Species are listed where GBIF holds occurrence records for them in this country. Record counts are not published here because the figure cannot be reproduced from a public GBIF query.
National park in Kavango West, mapped and named in the open record for Namibia. OpenStreetMap.
Water and Ocean in Namibia.
Namibia is one of the driest countries in sub-Saharan Africa, with perennial rivers only along its borders, the Orange, Kunene, Okavango and Zambezi, and an interior reliant on ephemeral rivers, groundwater, coastal desalination and Windhoek's pioneering direct reuse of reclaimed water. About 84.3% of people use at least a basic drinking water service (World Bank JMP, 2020) and treated town tap water is safe.
Does Namibia have enough fresh water? Yes, with headroom
Windhoek recycles and treats its water successfully; elsewhere bottle or filter.
Cleanest water: The perennial Kunene and Okavango rivers in the north.
How much fresh water does Namibia have, per person?
2,132 m³
Namibia
1,000 m³
the UN “water scarce” line
Namibia withdraws about 103 million cubic metres of fresh water a year (2022). That is 0.3% of the fresh water actually available to it, which FAO counts as no water stress. Of what is taken, farming takes 71%, homes and towns 22%, industry 7%. Source: FAO AQUASTAT.
What are the rules on Namibia beaches?
·Tap water: Varies.
✕Plastic rules: Plastic bags banned in national parks and protected areas, no full national ban yet..
✕Solo travel: rated take care on the record for this destination.
✕Marine protection: 1.71% of the sea is protected. The 30x30 pledge for 2030 is not met yet.
Named on the open map: Agate Beach, Independence Beach, Nordstrand, Pebble Beach, Vogelstrand, Angra Fria. That is 7 named beaches in the public record for Namibia, each one a place you can look up before you go. OpenStreetMap.
Where does the sewage go?
38.7%
of people have at least basic sanitation
38.7% of people here use at least a basic toilet not shared with other households (2024, World Bank / WHO UNICEF JMP). No figure is published for how much of that waste is safely treated, so the share reaching the ground or the water untreated is unknown.
How is the sea around Namibia doing?
One cross-section, every answer measured.
Surface
What the coast carries
Cold coastal fog, baking interior; the rainy season is Jan–Apr.
Nearshore
Protected water
1.71% of territorial waters are protected, against the 30% pledged for 2030 under the Global Biodiversity Framework.
Cleanest
Where the water is cleanest
The perennial Kunene and Okavango rivers in the north..
The record
Measured
Namibia is one of the driest countries in sub-Saharan Africa, with perennial rivers only along its borders, the Orange, Kunene, Okavango and Zambezi, and an interior reliant on ephemeral rivers, groundwater, coastal desalination and Windhoek's pioneering direct reuse of reclaimed water. About 84.3% of people use at least a basic drinking water service (World Bank JMP, 2020) and treated town tap water is safe.
Namibia scored 64 out of 100 on the Ocean Health Index in its 2025 assessment, below the global average of 72, and ranked 182nd of 220 coastal regions. The index team says it is no longer updating scores, so the 2025 figures may be the last.
Sea protected
1.7%
Against the 30% pledged for 2030 under the Global Biodiversity Framework.
Threatened species
144 (mammals, birds, fish & plants)
Mammals, birds, fish and higher plants on the IUCN list.
Is the tap water safe in Namibia?
NamWater, the state owned bulk supplier, runs the dams, pipelines and treatment plants, and sells water to municipalities, which pipe it to homes and businesses. In Windhoek part of the drinking water is reclaimed from wastewater at the Goreangab plant, which Veolia says supplies about 35 per cent of the city's needs after treatment steps including ozone, activated carbon, ultrafiltration and chlorination, with monitoring after every step. WHO and UNICEF estimate that 86.5 per cent of Namibians had at least basic drinking water in 2024, but there is no national estimate of safely managed water. Town supplies are treated, while in rural areas, from boreholes or after flooding, boil or filter the water.
How hard is the water supply being pushed?
Of every 10 buckets nature refills, 0 are already taken. Withdrawals run at 0.3% of what Namibia renews internally each year (2022, World Bank / FAO AQUASTAT). That is inside the 25% mark generally treated as water stress, so the supply has headroom.
When is the best time to visit Namibia? Tap your month.
Tap your month.
JanFebMarAprMayJunJulAugSepOctNovDec
.
How much fresh water does Namibia actually have?
Nature renews about 2,132 cubic metres of fresh water per person per year here. That ranks Namibia 82 of 208 countries measured, putting it in the drier half of the world. The UN treats anything under 1,000 cubic metres as water scarce, and this is above that line. World Bank / FAO AQUASTAT.
Namibia grows maize, millet and sorghum, but harvests swing with the rains, and imports, mostly maize and wheat from South Africa, cover about two-thirds of the country's cereal needs in an average year.
Where does the food in Namibia come from?
13.2% imported
about US$1,114m a year
On the plate: Mahangu (pearl millet) porridge, maize, beans, spinach and wild greens.
1 of 10
bites are imported
Namibia buys in more food energy than it eats. About US$1,114m a year leaves the country to pay for it. The green slice is roughly what still grows here.
About 13.2% of everything Namibia buys in from abroad is food, roughly 1 in every 10 imported items on the dock (2024, World Bank). Farming itself is 7% of the economy and 47.1% of the land is agricultural, of which 1% is arable. The green slice is roughly what still grows here.
What is killing people in Namibia? The imported diet.
Cause of death, and the diet behind it.
Non-communicable diseases, all combined29.9%
Diabetes5.3%
There is no national count. In November 2023 Dr Hileni Samuel, a diabetologist at Windhoek Central Hospital, said diabetes had led to 24 amputations at that hospital and 54 at Katutura Intermediate Hospital, without saying over what period. The Khomas region recorded 10,802 people with diabetes at its public hospitals in 2023, up from 6,403 in 2022. Source: New Era.
Adults living with overweight or obesity. 36.5%.
Can Namibia feed itself?
1.0%
Arable land
47.1%
Agricultural land
257,515
Farmers
1,976,840
Arable acres
7.0%
Agriculture, share of GDP
Harvest: Mahangu harvest around April to June after the summer rains.
Feeding itself
The arid climate limits agriculture to livestock ranching and northern mahangu millet, so Namibia imports a large share of its cereals and staple foods in most years.
Certification
Certified organic cropland is minimal and a national share could not be verified, but Namibia's wild-harvested Devil's Claw is certified organic and FairWild for export, giving it a genuine if narrow organic sector.
Water for crops
Namibia is one of the driest countries in sub-Saharan Africa, with perennial rivers only along its borders, the Orange, Kunene, Okavango and Zambezi, and an interior reliant on ephemeral rivers, groundwater, coastal desalination and Windhoek's pioneering direct reuse of reclaimed water. About 84.3% of people use at least a basic drinking water service (World Bank JMP, 2020) and treated town tap water is safe.
Why the organic number looks like that. Certified-organic farmland is not separately reported for Namibia, and that is a certification gap rather than proof nothing is grown cleanly. What the official land record does show: 47.1% of the country is agricultural land and 1% is arable (2023, World Bank). Certification is paid for per farm per year by a foreign body, which prices out smallholders, so the organic number reads worse than the practice.
The plant-based kitchen here is not an import. By tonnage, the largest crops grown in Namibia are roots and tubers, grapes and maize (FAO, FAOSTAT crop production, 2024). That is what the land itself puts on a plate.
Buy where residents buy: the Green Market (Bio Markt) at the New Apostolic Church on Dr Kenneth David Kaunda Street in Klein Windhoek, on Saturday mornings, with vegetables, dairy, bread, honey, jams and chutneys; and in Katutura, Windhoek, the Oshetu Community Market on the site of the old Single Quarters, known for kapana grilled meat, plus the Olyeeta and Tukondjeny markets, which sell mahangu millet, sorghum, dried wild spinach (ombidi), collard greens and dried cassava. These are public markets rather than farm shops we have checked, so confirm days before you go.
Not yet checked by us. Plant based kitchens listed publicly: The Vege Table, Nature's Path, vegetarian and vegan café in Swakopmund: simple meals, mainly takeaway; Wild Rocket Cafe, health café in Swakopmund: quinoa bowl, veggie wrap, falafel and plant milk drinks; KAUAI Klein Kuppe, health food restaurant in Windhoek: labelled vegan burger, wrap and salads; Seoul Food, Korean restaurant in Windhoek: vegan bibimbap, kimchi and stir fried vegetables; Goodfellas Pizza and Pub, pizzeria in Windhoek: marked vegan pizza with plant cheese and a vegan burger. Tell us how they are.
Namibia is a very low emitter at about 1.1 tonnes per person in 2024, and its domestic generation leans on low-carbon sources, chiefly the Ruacana hydropower station plus fast-growing solar, together supplying around 40 per cent of home-produced electricity. The country imports much of its remaining power from South Africa's coal-heavy grid, which is its main indirect emissions burden. Policy ambition is high, with one of the more ambitious NDCs and a national Green Hydrogen Strategy aiming to make Namibia a major exporter of clean fuels. Abundant sun and wind underpin projects such as Hyphen that could reshape its energy future. Very low emissions and strong clean-energy ambition earn a high score, capped by reliance on imported coal power.
What powers Namibia?
Renewable 97.6%Fossil 2.4%
NamPower, the national state owned power utility, covers the whole electricity chain from generation and transmission to distribution, supply and energy trading, under the oversight of the Ministry of Industries, Mines and Energy. Its main plants are the Ruacana hydro station (347 MW), the Van Eck coal station (120 MW) and the Anixas diesel station (22.5 MW). Its activities are licensed and regulated by the Electricity Control Board. A Chinese led joint venture holds a N$1.4 billion contract to build a 100 MW solar plant at Rosh Pinah.
Climate pollution per person
The safe amount, what the planet can absorb
2 tonnes
One person here
1.2 tonnes
The world average, for comparison
4.7 tonnes
The worst it ever got
1.6 tonnes
The grid
Namibia is a very low emitter at about 1.1 tonnes per person in 2024, and its domestic generation leans on low-carbon sources, chiefly the Ruacana hydropower station plus fast-growing solar, together supplying around 40 per cent of home-produced electricity. The country imports much of its remaining power from South Africa's coal-heavy grid, which is its main indirect emissions burden.
Pollution
Plastic bags are banned in national parks and protected areas, and the desert air is very clean, though there is no full national ban, mining raises local dust and mean annual PM2.5 exposure was 14.2 micrograms per cubic metre in 2023 (World Bank).
Water stress
Namibia is one of the driest countries in sub-Saharan Africa, with perennial rivers only along its borders, the Orange, Kunene, Okavango and Zambezi, and an interior reliant on ephemeral rivers, groundwater, coastal desalination and Windhoek's pioneering direct reuse of reclaimed water. About 84.3% of people use at least a basic drinking water service (World Bank JMP, 2020) and treated town tap water is safe.
What pollutes most here
1The gridThe share of electricity still generated from fossil fuel.60%
2IndustryUranium and diamond mining in Erongo and the coastal Sperrgebiet..named
3AirModelled annual mean against a WHO guideline of 5 µg/m³.14.2 µg/m³ (PM2.5)
4On the recordPlastic bags are banned in national parks and protected areas, and the desert air is very clean, though there is no full national ban, mining raises local dust and mean annual PM2.5 exposure was 14.2 micrograms per cubic metre in 2023 (World Bank).
What has Namibia promised on climate?
Net zero, whole economy2050
Electricity renewable today93.4% (2021)
Land protected, against a 30% target39.9% by 2025
Sea protected, against a 30% target1.7% by 2025
The net-zero target year on file with Climate Watch is 2050, status: in policy document. Measured against it, 93.4% of electricity is already renewable (2021, World Bank), so 6.6% of the grid is still to be converted. The pledge on file is measured here against what has actually been delivered, not taken on its own (UNFCCC NDC Registry, CBD Kunming-Montreal Target 3).
The biggest line item
One return flight against a whole year of living.
A resident's entire year1.2 t CO2e
Safe-climate budget, per year2 t CO2e
Los Angeles return, economy2.8 t CO2e
Sydney return, economy2.18 t CO2e
New York return, economy2.11 t CO2e
Singapore return, economy1.76 t CO2e
London return, economy1.52 t CO2e
How much CO2 does flying to Namibia emit?
Tap where you would fly from. One return flight, economy.
Los AngelesSydneyNew YorkSingaporeLondon
.
Firsts on climate finance. The Green Climate Fund lists 12 projects involving Namibia, with US$147 million of GCF financing, plus US$5.3 million in readiness support. Its first two Namibian projects were approved on 14 October 2016, both through the national Environmental Investment Fund: US$9.5 million for climate resilient farming in three northern crop regions (FP023), and a US$10 million grant to help communities adapt through natural resource management (FP024). The fund describes FP024 as the first enhanced direct access project its board approved.
Every prompt runs on a machine in a building on somebody’s grid. What that costs the planet depends less on the prompt than on what is burning to power it. Here is what would power one in Namibia.
Data centres
1
Registered colocation and interconnection facilities, PeeringDB, 2026
Grid renewable
97.6 %
What a machine here runs on.
What powers a data centre in Namibia?
Running AI here is about as clean as it currently gets.
Renewable 97.6%Fossil 2.4%
Cooling water. Every one of those halls runs on the national grid, which is 93.4% renewable today (World Bank). A data centre is only as clean as the electricity behind it, so the same figure that decides this country's climate score also decides the footprint of the AI running inside it. Cooling water use is not separately published by facility, and no operator here reports it.
The rules. Namibia has 1 colocation and interconnection facilities on the public PeeringDB register, concentrated in Windhoek (1), alongside 1 internet exchange (IXP Namibia). Named sites include Paratus Armada.
Where the cables land. 1 landing points · Swakopmund
65% residents to 35% visitors across a year. 1,651,000 international arrivals in 2019 against 3,092,816 people who live here (2025, World Bank / UN Tourism).
Where a visitor dollar goes in Namibia
187k
Visitors a year
0.1
Visitors per resident
How deep in debt is Namibia?· for every $100 Namibia earns in a year, it owes…
Pay to the order of: the creditorsmemo · today
$ 70What is owed now, for every $100 of national income (2026).
IMF World Economic Outlook, 2026signed, the creditors
Pay to the order of: the creditorsmemo · projected 2031
$ 76The IMF's own forecast has this rising to $76 by 2031.
IMF World Economic Outlook projection, 2031signed, the forecast
For every $100 Namibia earns in a year, it owes $70 (2026, IMF World Economic Outlook). The interest on that is paid before schools, clinics or coastline get their turn.
Where does a tourist dollar actually go in Namibia?
Play one tourist dollar around the board. Every square is a measured fact from this page.
START!
1
GO: a visitor lands
$100 goes on the table. 1,651,000 international arrivals in 2019 against 3,092,816 residents, 0.5 visitors for every resident (World Bank / UN Tourism).
$100 in play
2
The bed
Who owns the largest places to stay in Namibia is not published in the records we can check, so this square is left open rather than guessed. Where a listing names its owner, it is shown in the ownership table below.
not published
3
The plate
Food is only 13.2% of everything Namibia imports (2024, World Bank), so most of a meal is bought from producers inside the country. Eating what the land here actually grows, root vegetables, maize, grapes, onions, wheat, fruits, pulses, vegetables, keeps that money with the grower.
mostly home-grown
4
The power
93.4% of the electricity is renewable (2021, World Bank), so the energy on the bill is mostly generated inside the country rather than shipped in.
made at home
5
What actually stays
Of the two parts of a visitor's bill that can be measured here, the plate and the power stay inside Namibia. This is not an economy where a visitor's money drains away, and the board is shorter for it.
most of it
6
Pay the bank first
Namibia owes $70 for every $100 it earns (IMF World Economic Outlook, 2026 projection). The interest is paid before anything else on this board.
$70 per $100
7
No plan B
35.0% of everything Namibia sells abroad is pearls, gemstones and precious metals (2023, UN Comtrade). One market moving takes the whole board with it.
35.0% one export
8
Community chest
Tourism earns 4% of everything Namibia makes from exports (2020, World Bank / UN Tourism). That is how much of the economy depends on the game continuing.
4% of exports
9
The flight
Getting here is usually the biggest single line on the bill. From Los Angeles a return economy seat is 2.80 t CO2, on the UK Government's published conversion factors. It is the one part of the trip this board cannot reduce.
2.80 t CO2
10
Back to GO
The economy turns over about US$17 billion a year (IMF World Economic Outlook, 2026 projection). Every lap of this board is a choice about how much of it stays.
US$17bn
GDPUS$15.1bn
Agriculture, share of GDP7%
Visitors a year187,100
Visitors per resident0.1
Residents~3,092,816
Agriculture
Farming is 7% of the economy. The arid climate limits agriculture to livestock ranching and northern mahangu millet, so Namibia imports a large share of its cereals and staple foods in most years.
Natural materials
Karakul (Swakara) wool and leather sit alongside living San, Himba and Kavango craft in leatherwork, ostrich-shell beadwork and palm basketry.
Energy
Namibia is a very low emitter at about 1.1 tonnes per person in 2024, and its domestic generation leans on low-carbon sources, chiefly the Ruacana hydropower station plus fast-growing solar, together supplying around 40 per cent of home-produced electricity. The country imports much of its remaining power from South Africa's coal-heavy grid, which is its main indirect emissions burden.
Who owns the biggest hotels in Namibia?
By rooms · company records and press.
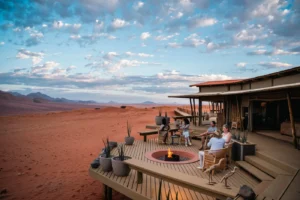
Wolwedans · ~19 roomsIndependentnot published
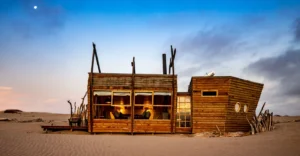
Shipwreck Lodge · ~10 roomsIndependentnot published
Wilderness Little Kulala · ~11 roomsIndependentnot published
Visitors, over time
20151,488k
20161,551k
20171,581k
20181,639k
20191,651k
2020187k
International tourism receipts run at about US$0.15 billion in 2020 (World Bank / UN Tourism). That is 4% of everything the country earns from exports.
How much of your money actually stays here?
Tap the holiday you are planning.
All-inclusive resortForeign-owned hotel and tourist restaurantsLocally owned stay and local restaurantsGuesthouse, markets and public transport
Resort guest, villa renter, family, nomad or backpacker. The honest playbook for each, from the same sourced numbers.
Already booked a resort? · the rescue list
Practical swaps that keep more of your money in the local economy
1. Eat where the country eats Choose kitchens cooking what the land here grows, root vegetables, maize, grapes, onions, wheat, fruits, pulses and vegetables, over an imported menu.
2. Book with a local operator Never the lobby desk. The margin on a tour is the part that stays.
3. Stay somewhere locally owned Ownership decides where the room rate books. Eco stays →
4. Use the transport residents use Self-drive on gravel roads, a 4x4 for the north and west, with great distances between towns.
5. Buy the craft, not the souvenir Natural-materials work made here pays the maker directly; imported gifts pay a shipping line.
swipe →
First time here
An arid, sparsely peopled land of red dunes and desert-adapted wildlife, run in large part through community conservancies that channel tourism revenue to residents.
Best time: The dry winter, best for wildlife.
Getting around
Self-drive on gravel roads, a 4x4 for the north and west, with great distances between towns.
Transport is where the fare either stays or leaves.
Eating here
The everyday plate that actually grows here is root vegetables, maize, grapes, onions, wheat, fruits, pulses and vegetables. Ordering those keeps the money with the grower and cuts the imported share of the meal.
Eating what the country grows is the cheapest way to cut the import bill.
Good to know
Cards in towns, cash in the bush; NAD pegged to the rand. Dust is a constant.
Rate my hotel. Tap yours for the honest verdict.
Ownership from company records and press.
WolwedansShipwreck LodgeWilderness Little Kulala
.
Who owns the big hotels
WolwedansIndependent · 19 rooms
Shipwreck LodgeIndependent · 10 rooms
Wilderness Little KulalaIndependent · 11 rooms
None of the 3 properties listed here publishes who ultimately owns it, so no claim is made either way. Ownership is what decides how much of a room rate stays in the country, which is why we show it when a listing states it.
Society and Governance in Namibia.
How well is Namibia actually run?
Governance, measured · World Bank WGI
Four measured answers, none of them opinion. Averaged across corruption control, delivery and accountability, Namibia scores 55 out of 100 (2024, World Bank Worldwide Governance Indicators). That matters here because every pledge on this page is only as good as the machinery meant to deliver it.
How well is Namibia run? · each scored out of 100, higher is better
Clean government, scored 50 of 100
Control of corruption scores 50.4 out of 100 (2024, World Bank Worldwide Governance Indicators). That is above the halfway mark of governments measured.
50
Freedom and rights, scored 65 of 100
Voice and accountability, which measures free expression, free media and the ability to choose a government, scores 64.6 out of 100 (2025, World Bank WGI). Citizens have some room to question their government.
65
Government effectiveness, scored 54 of 100
Government effectiveness, which measures the quality of public services and how well policy is actually delivered, scores 54.4 out of 100 (2025, World Bank WGI). Delivery is rated above average.
54
Income equality, scored 59 of 100
The Gini index of income inequality reads 59.1 (2015, World Bank). Zero is perfect equality and 100 is one person holding everything. Above 40 is the level usually treated as socially strained, and Namibia sits above it.
59
LGBTQ+ status: MixedSolo female travel: Take care87.6% adult literacyIndustry to avoid: Uranium and diamond mining in Erongo and the coastal Sperrgebiet.
What is daily life in Namibia really like? Measured
Getting around, breathing, throwing away, learning. The honest checklist.
TransportAirWaterWastePower
✓How you get around Self-drive on gravel roads, a 4x4 for the north and west, with great distances between towns.
✓Air quality, measured Modelled annual mean 14.2 µg/m³ (PM2.5). The WHO guideline is 5 µg/m³.
✓Where the air is cleanest The Namib Desert and NamibRand.
✓Tap water Varies
✓What to drink Windhoek recycles and treats its water successfully; elsewhere bottle or filter.
✓Plastic rules Plastic bags banned in national parks and protected areas, no full national ban yet.
✓Sockets and voltage Type C/D/M, 230V
87.6%
literacy. Public spending on education runs at 9.1% of GDP and 24.6% of all government spending, and secondary enrolment stands at 82.0% gross (UNESCO Institute for Statistics, 2024 to 2025).
Made in Namibia.
Karakul (Swakara) wool and leather sit alongside living San, Himba and Kavango craft in leatherwork, ostrich-shell beadwork and palm basketry. Every step of processing done at home is value that stops leaving the country.
What Namibia actually sells the world
The single biggest thing Namibia sells the world is pearls, gemstones and precious metals, 35.0% of all exports in 2023 (about US$1.93 billion, UN Comtrade). The next four are ores, slag and ash at 16.6%, fish and seafood at 14.3%, mineral fuels and oils at 5.7%, copper at 4.6%.
Made now · natural materials
Karakul (Swakara) wool
Worked in Namibia from local material, and still a working craft rather than a museum piece.
Made now · natural materials
Leather sit alongside living San
Worked in Namibia from local material, and still a working craft rather than a museum piece.
Made now · natural materials
Himba
Worked in Namibia from local material, and still a working craft rather than a museum piece.
Made now · natural materials
Kavango craft in leatherwork
Worked in Namibia from local material, and still a working craft rather than a museum piece.
Made now · natural materials
Ostrich-shell beadwork
Worked in Namibia from local material, and still a working craft rather than a museum piece.
Made now · natural materials
Palm basketry
Worked in Namibia from local material, and still a working craft rather than a museum piece.
Buys in · 10.5% of imports
Machinery and mechanical appliances
Namibia imported US$0.77 billion of machinery and mechanical appliances in 2023, 10.5% of everything it bought abroad, and sells none of it back. Every point of that is a business that could be built at home rather than shipped in. UN Comtrade.
Buys in · 9.2% of imports
Vehicles
Namibia imported US$0.67 billion of vehicles in 2023, 9.2% of everything it bought abroad, and sells none of it back. Every point of that is a business that could be built at home rather than shipped in. UN Comtrade.
Buys in · 6.3% of imports
Electrical machinery and electronics
Namibia imported US$0.46 billion of electrical machinery and electronics in 2023, 6.3% of everything it bought abroad, and sells none of it back. Every point of that is a business that could be built at home rather than shipped in. UN Comtrade.
Buys in · 2.8% of imports
Iron and steel articles
Namibia imported US$0.20 billion of iron and steel articles in 2023, 2.8% of everything it bought abroad, and sells none of it back. Every point of that is a business that could be built at home rather than shipped in. UN Comtrade.
The maths for an entrepreneur. Namibia produces about US$15 billion a year, which is roughly US$4,876 per person (2025, World Bank). Farming is 7% of that, while food is 13.2% of everything the country imports. The country buys in more food than its own farms contribute to the economy, and every point of that gap is a business someone could build here rather than ship in.
The holy fire sits between the main house and the kraal in OvaHerero and OvaMbanderu homesteads. It is believed to be where the ancestors and the creator reside, and it is used for treating ailments, naming newborn babies and other purposes.
August
OvaHerero Otjiserandu commemorations
Each August the Ovaherero gather in Okahandja to mark the return of Paramount Chief Samuel Maharero's remains in 1923. On Red Flag Day, troops of the Red Flag march to the graves to honour the fallen.
At key social occasions
Nama≠Nāb, the Nama dance steps
The dancing steps of the Nama people, which go with Nama ancestral music played on the musical bow, traditional guitar, accordion and harmonica. UNESCO added this music to its list of heritage in need of urgent safeguarding in 2020.
Does Namibia protect its heritage by law?
Partly, and the gaps say as much as the protections.
What is kept alive. Namibia is home to some of the oldest continuously living cultures on earth, and ancestral traditions remain strong. The San, including the Ju/'hoansi of Nyae Nyae, keep deep hunting and tracking knowledge and the healing or trance dance, one of the most closely documented Indigenous healing traditions in southern Africa. The OvaHimba maintain ancestor veneration around the holy fire and their distinctive ochre dress, while the OvaHerero hold Otjiserandu commemorations in their well-known Victorian-influenced attire.
Who it belongs to. Living Himba, San, Herero, Damara and Nama communities remain central to the country, and the communal conservancy model directs tourism and wildlife revenue to residents, a widely cited global example of community-based natural resource management.
Only here. Welwitschia mirabilis, a Namib living-fossil plant that can survive over a thousand years..
Three futures for Namibia, every one run forward from measured data.
Where the making actually happens
Named cultural and craft sites on the open map: Craft Centre Parking (Windhoek), Tsumkwe Craft Centre (closed) (Otjozondjupa), Craft Café (Windhoek), Independence Memorial Museum (Windhoek), Museum Swakopmund (Swakopmund). OpenStreetMap. Named craft workshops on the open map: Aurora Curios & Gifts Shop, Dishouwdt, Kaleidoscope, Knerts Creations & Craft, Kumbula Africa, Ohambo Store.
Every measured trend on one line
Run forward at the pace already recorded.
-4%
Forest cover
1995: 10.2% → 2024: 9.77%
-4%
Renewable electricity
1995: 96.8% → 2021: 93.4%
+8%
CO2 per person
1995: 1.12 t → 2024: 1.2 t
-56%
Tourist arrivals
1995: 421k → 2020: 187k
-9%
Protected land
2013: 44% → 2025: 39.9%
-46%
Farm workforce
1995: 41% → 2025: 22.3%
+0%
Protected sea
2013: 1.7% → 2025: 1.7%
-0%
Agricultural land
1995: 47.2% → 2024: 47.1%
+77%
Urban population
1995: 28.7% → 2025: 50.9%
-11%
Air pollution
1995: 16 µg/m³ → 2023: 14.2 µg/m³
-45%
Fresh water per person
1995: 3,845 m³ → 2022: 2,132 m³
+73%
Adult overweight
1995: 21.2% → 2022: 36.5%
+98%
Electricity access
1995: 30% → 2024: 59.3%
+96%
GDP per person
1995: 2,483 → 2025: 4,876
+93%
Population
1995: 1,602k → 2025: 3,093k
-7%
Renewable energy use
1995: 32.1% → 2021: 30%
+18%
Energy per person
1995: 572 kg → 2024: 677 kg
-9%
Protected area, total
2013: 26.9% → 2025: 24.4%
+17%
Life expectancy
1995: 57.5 yrs → 2024: 67.5 yrs
-16%
Cereal yield
1995: 220 kg/ha → 2024: 184 kg/ha
+22027%
Fertiliser use
1998: 0.12 kg/ha → 2024: 27.1 kg/ha
-31%
Rural population
1995: 71.3% → 2025: 49.1%
+533%
Water productivity
1995: 17.3 $/m3 → 2022: 110 $/m3
-6%
Health spending
2000: 10% → 2023: 9.48%
-4%
Forest area
1995: 84,141 km2 → 2025: 80,430 km2
+29%
Electric power use
1995: 969 kWh → 2024: 1,246 kWh
+7%
Emissions: Agriculture
1990: 7.6 MtCO2e → 2023: 8.14 MtCO2e
+11300%
Emissions: Industrial Processes
1990: 0.01 MtCO2e → 2023: 1.14 MtCO2e
World Bank open data, recorded series
How much forest is left?
Forest cover moved from 10.2% to 9.77% across 29 recorded years.
World Bank, Forest area (% of land area) (AG.LND.FRST.ZS) https://data.worldbank.org/indicator/AG.LND.FRST.ZS?locations=NA
How clean is the grid?
Renewable electricity moved from 96.8% to 93.4% across 26 recorded years.
World Bank, Renewable electricity output (% of total electricity output) (EG.ELC.RNEW.ZS) https://data.worldbank.org/indicator/EG.ELC.RNEW.ZS?locations=NA
How much climate pollution per person?
CO2 per person moved from 1.12 t to 1.2 t across 29 recorded years.
World Bank, Carbon dioxide (CO2) emissions excluding LULUCF per capita (t CO2e/capita) (EN.GHG.CO2.PC.CE.AR5) https://data.worldbank.org/indicator/EN.GHG.CO2.PC.CE.AR5?locations=NA
How many people visit?
Tourist arrivals moved from 421k to 187k across 25 recorded years.
World Bank, International tourism, number of arrivals (ST.INT.ARVL) https://data.worldbank.org/indicator/ST.INT.ARVL?locations=NA
How much land is protected?
Protected land moved from 44% to 39.9% across 12 recorded years.
World Bank, Terrestrial protected areas (% of total land area) (ER.LND.PTLD.ZS) https://data.worldbank.org/indicator/ER.LND.PTLD.ZS?locations=NA
How many people still farm?
Farm workforce moved from 41% to 22.3% across 30 recorded years.
World Bank, Employment in agriculture (% of total employment) (modeled ILO estimate) (SL.AGR.EMPL.ZS) https://data.worldbank.org/indicator/SL.AGR.EMPL.ZS?locations=NA
How much sea is protected?
Protected sea moved from 1.7% to 1.7% across 12 recorded years.
World Bank, Marine protected areas (% of territorial waters) (ER.MRN.PTMR.ZS) https://data.worldbank.org/indicator/ER.MRN.PTMR.ZS?locations=NA
How much land is farmed?
Agricultural land moved from 47.2% to 47.1% across 29 recorded years.
World Bank, Agricultural land (% of land area) (AG.LND.AGRI.ZS) https://data.worldbank.org/indicator/AG.LND.AGRI.ZS?locations=NA
How fast is it urbanising?
Urban population moved from 28.7% to 50.9% across 30 recorded years.
World Bank, Urban population (% of total population) (SP.URB.TOTL.IN.ZS) https://data.worldbank.org/indicator/SP.URB.TOTL.IN.ZS?locations=NA
Is the air getting cleaner?
Air pollution moved from 16 µg/m³ to 14.2 µg/m³ across 28 recorded years.
World Bank, PM2.5 air pollution, mean annual exposure (micrograms per cubic meter) (EN.ATM.PM25.MC.M3) https://data.worldbank.org/indicator/EN.ATM.PM25.MC.M3?locations=NA
Is water getting scarcer?
Fresh water per person moved from 3,845 m³ to 2,132 m³ across 27 recorded years.
World Bank, Renewable internal freshwater resources per capita (cubic meters) (ER.H2O.INTR.PC) https://data.worldbank.org/indicator/ER.H2O.INTR.PC?locations=NA
Is diet-related disease rising?
Adult overweight moved from 21.2% to 36.5% across 27 recorded years.
World Bank, Prevalence of overweight (% of adults) (SH.STA.OWAD.ZS) https://data.worldbank.org/indicator/SH.STA.OWAD.ZS?locations=NA
Who has power?
Electricity access moved from 30% to 59.3% across 29 recorded years.
World Bank, Access to electricity (% of population) (EG.ELC.ACCS.ZS) https://data.worldbank.org/indicator/EG.ELC.ACCS.ZS?locations=NA
Is income rising?
GDP per person moved from 2,483 to 4,876 across 30 recorded years.
World Bank, GDP per capita (current US$) (NY.GDP.PCAP.CD) https://data.worldbank.org/indicator/NY.GDP.PCAP.CD?locations=NA
How fast is it growing?
Population moved from 1,602k to 3,093k across 30 recorded years.
World Bank, Population, total (SP.POP.TOTL) https://data.worldbank.org/indicator/SP.POP.TOTL?locations=NA
What share of all energy is renewable?
Renewable energy use moved from 32.1% to 30% across 26 recorded years.
World Bank, Renewable energy consumption (% of total final energy consumption) (EG.FEC.RNEW.ZS) https://data.worldbank.org/indicator/EG.FEC.RNEW.ZS?locations=NA
How much energy does one person use?
Energy per person moved from 572 kg to 677 kg across 29 recorded years.
World Bank, Energy use (kg of oil equivalent per capita) (EG.USE.PCAP.KG.OE) https://data.worldbank.org/indicator/EG.USE.PCAP.KG.OE?locations=NA
How much land and sea is protected together?
Protected area, total moved from 26.9% to 24.4% across 12 recorded years.
World Bank, Terrestrial and marine protected areas (% of total territorial area) (ER.PTD.TOTL.ZS) https://data.worldbank.org/indicator/ER.PTD.TOTL.ZS?locations=NA
How long do people live?
Life expectancy moved from 57.5 yrs to 67.5 yrs across 29 recorded years.
World Bank, Life expectancy at birth, total (years) (SP.DYN.LE00.IN) https://data.worldbank.org/indicator/SP.DYN.LE00.IN?locations=NA
How much does a hectare of cereal produce?
Cereal yield moved from 220 kg/ha to 184 kg/ha across 29 recorded years.
World Bank, Cereal yield (kg per hectare) (AG.YLD.CREL.KG) https://data.worldbank.org/indicator/AG.YLD.CREL.KG?locations=NA
How much fertiliser goes on the land?
Fertiliser use moved from 0.12 kg/ha to 27.1 kg/ha across 26 recorded years.
World Bank, Fertilizer consumption (kilograms per hectare of arable land) (AG.CON.FERT.ZS) https://data.worldbank.org/indicator/AG.CON.FERT.ZS?locations=NA
How many people still live rurally?
Rural population moved from 71.3% to 49.1% across 30 recorded years.
World Bank, Rural population (% of total population) (SP.RUR.TOTL.ZS) https://data.worldbank.org/indicator/SP.RUR.TOTL.ZS?locations=NA
How much value per cubic metre of water?
Water productivity moved from 17.3 $/m3 to 110 $/m3 across 27 recorded years.
World Bank, Water productivity, total (constant 2015 US$ GDP per cubic meter of total freshwater withdrawal) (ER.GDP.FWTL.M3.KD) https://data.worldbank.org/indicator/ER.GDP.FWTL.M3.KD?locations=NA
How much goes on health?
Health spending moved from 10% to 9.48% across 23 recorded years.
World Bank, Current health expenditure (% of GDP) (SH.XPD.CHEX.GD.ZS) https://data.worldbank.org/indicator/SH.XPD.CHEX.GD.ZS?locations=NA
How much forest is there in total?
Forest area moved from 84,141 km2 to 80,430 km2 across 30 recorded years.
World Bank, Forest area (sq. km) (AG.LND.FRST.K2) https://data.worldbank.org/indicator/AG.LND.FRST.K2?locations=NA
How much electricity per person?
Electric power use moved from 969 kWh to 1,246 kWh across 29 recorded years.
World Bank, Electric power consumption (kWh per capita) (EG.USE.ELEC.KH.PC) https://data.worldbank.org/indicator/EG.USE.ELEC.KH.PC?locations=NA
How have agriculture emissions moved?
Agriculture emissions moved from 7.6 to 8.14 MtCO2e across 33 recorded years.
Climate Watch (WRI), historical emissions
How have industrial processes emissions moved?
Industrial Processes emissions moved from 0.01 to 1.14 MtCO2e across 33 recorded years.
Climate Watch (WRI), historical emissions
Worst caseCurrent pathBest case
Worst case
Every measured decline continues at the pace already recorded. The weakest pillar, recycling at 1/5, is the one that gives way first.
Computed from: recorded series extended with no policy change
Current path
Every line above is a recorded World Bank series for this country. The current path is simply those series continuing at the pace already measured.
Computed from: recorded series, no policy change assumed
Best case
The pledges are met on their own stated timetables and the weakest pillars are lifted to match the strongest. Namibia already shows it can do this: energy scores 5/5.
Computed from: each published target delivered on its own date
What the best case actually asks for
Lift recycling
It scores 1 out of 5 today, among the weakest parts of Namibia's record. Formal recycling is limited, with kerbside schemes such as Rent-A-Drum operating in Windhoek but little collection nationally.
measured each year
Costs: spending and enforcement, not new technology
Lift plant-based eating
It scores 2 out of 5 today, among the weakest parts of Namibia's record. Mahangu porridge, maize, beans and wild greens provide a plant-based base, but the food culture is strongly meat-centred around beef and game and dedicated plant-based options are limited outside the capital.
measured each year
Costs: spending and enforcement, not new technology
Lift organic farming
It scores 2 out of 5 today, among the weakest parts of Namibia's record. Certified organic cropland is minimal and a national share could not be verified, but Namibia's wild-harvested Devil's Claw is certified organic and FairWild for export, giving it a genuine if narrow organic sector.
measured each year
Costs: spending and enforcement, not new technology
Government and Goals in Namibia.
Who is in charge of Namibia now · Office-holders from the UN Protocol and Liaison Service public list of Heads of State and Heads of Government, 20 October 2026. Legislature and election dates from IFES ElectionGuide. Constitution dates from the Constitute Project. Governance scores from the World Bank Worldwide Governance Indicators 2024.
Netumbo Nandi-Ndaitwah
President
Netumbo Nandi-Ndaitwah is the head of government of Namibia, in office since 21 March 2025. Every climate, protection and energy pledge on this page is delivered, or not, under this administration.
Public opinion, measured
Voice and accountability, the freedom to question government scores 64.6 out of 100 in 2025. On this World Bank scale, 100 is the strongest governance measured. Up from 64.5 in 2024. World Bank Worldwide Governance Indicators, 2025 data (updated 25 September 2026) https://www.worldbank.org/en/publication/worldwide-governance-indicators
Control of corruption scores 51.0 out of 100 in 2025. On this World Bank scale, 100 is the strongest governance measured. Down from 51.4 in 2024. World Bank Worldwide Governance Indicators, 2025 data (updated 25 September 2026) https://www.worldbank.org/en/publication/worldwide-governance-indicators
Political stability and absence of violence scores 78.6 out of 100 in 2025. On this World Bank scale, 100 is the strongest governance measured. Up from 76.3 in 2024. World Bank Worldwide Governance Indicators, 2025 data (updated 25 September 2026) https://www.worldbank.org/en/publication/worldwide-governance-indicators
Rule of law scores 64.8 out of 100 in 2025. On this World Bank scale, 100 is the strongest governance measured. Down from 65.0 in 2024. World Bank Worldwide Governance Indicators, 2025 data (updated 25 September 2026) https://www.worldbank.org/en/publication/worldwide-governance-indicators
Regulatory quality scores 56.7 out of 100 in 2025. On this World Bank scale, 100 is the strongest governance measured. Down from 58.1 in 2024. World Bank Worldwide Governance Indicators, 2025 data (updated 25 September 2026) https://www.worldbank.org/en/publication/worldwide-governance-indicators
Netumbo Nandi-NdaitwahPresident
ParliamentLegislature, bicameral
Last election27 November 2024
Constitution1990, as revised to 2014
Government typepresidential republic
Namibia national goals: climate commitments on record · as recorded by Climate Watch, World Resources Institute
2050
Net zero
In Policy Document
Net-zero target as recorded by Climate Watch. Status: In Policy Document (7/30/2021) ↗
The questions people actually type, answered in full sentences from the sourced data above.
swipe →
Is Namibia sustainable?
Namibia scores 65 out of 100 on the Throne Eco Index, across twelve equally weighted pillars. An arid, sparsely peopled land of red dunes and desert-adapted wildlife, run in large part through community conservancies that channel tourism revenue to residents.
Is the water in Namibia safe and plentiful?
Namibia is one of the driest countries in sub-Saharan Africa, with perennial rivers only along its borders, the Orange, Kunene, Okavango and Zambezi, and an interior reliant on ephemeral rivers, groundwater, coastal desalination and Windhoek's pioneering direct reuse of reclaimed water. About 84.3% of people use at least a basic drinking water service (World Bank JMP, 2020) and treated town tap water is safe.
Can Namibia feed itself?
The arid climate limits agriculture to livestock ranching and northern mahangu millet, so Namibia imports a large share of its cereals and staple foods in most years.
Is it easy to eat plant-based in Namibia?
Mahangu porridge, maize, beans and wild greens provide a plant-based base, but the food culture is strongly meat-centred around beef and game and dedicated plant-based options are limited outside the capital.
How much of Namibia is actually protected?
About 39.9% of the land is protected (World Bank, 2024), and Namibia was the first African country to write environmental protection into its constitution and pioneered communal conservancies that place a further large area under community conservation. Enforcement supports custodianship of the largest free-roaming black rhino population, while marine cover is about 1.71% of territorial waters.
What wildlife is left in Namibia?
Namibia holds desert-adapted elephants and lions found almost nowhere else, the largest free-roaming black rhino population, a global stronghold for cheetah, and Namib endemics such as the ancient Welwitschia plant. Conservancies have driven measurable wildlife recovery.
Is Namibia on clean energy?
Namibia is a very low emitter at about 1.1 tonnes per person in 2024, and its domestic generation leans on low-carbon sources, chiefly the Ruacana hydropower station plus fast-growing solar, together supplying around 40 per cent of home-produced electricity. The country imports much of its remaining power from South Africa's coal-heavy grid, which is its main indirect emissions burden. Policy ambition is high, with one of the more ambitious NDCs and a national Green Hydrogen Strategy aiming to make Namibia a major exporter of clean fuels.
How polluted is Namibia?
Plastic bags are banned in national parks and protected areas, and the desert air is very clean, though there is no full national ban, mining raises local dust and mean annual PM2.5 exposure was 14.2 micrograms per cubic metre in 2023 (World Bank).
Does recycling work in Namibia?
Formal recycling is limited, with kerbside schemes such as Rent-A-Drum operating in Windhoek but little collection nationally.
Is the farming in Namibia organic?
Certified organic cropland is minimal and a national share could not be verified, but Namibia's wild-harvested Devil's Claw is certified organic and FairWild for export, giving it a genuine if narrow organic sector.
Are there natural materials and craft in Namibia?
Karakul (Swakara) wool and leather sit alongside living San, Himba and Kavango craft in leatherwork, ostrich-shell beadwork and palm basketry.
Is there living culture in Namibia?
Living Himba, San, Herero, Damara and Nama communities remain central to the country, and the communal conservancy model directs tourism and wildlife revenue to residents, a widely cited global example of community-based natural resource management.
What heritage does Namibia keep alive?
Namibia is home to some of the oldest continuously living cultures on earth, and ancestral traditions remain strong. The San, including the Ju/'hoansi of Nyae Nyae, keep deep hunting and tracking knowledge and the healing or trance dance, one of the most closely documented Indigenous healing traditions in southern Africa. The OvaHimba maintain ancestor veneration around the holy fire and their distinctive ochre dress, while the OvaHerero hold Otjiserandu commemorations in their well-known Victorian-influenced attire.
So is Namibia actually green? The measured answer
What is working: land protected at 39.9%, renewable electricity at 93.4%.
What is not: sea protected at 1.7% against a 30% mark.
Namibia sits 38 of 77 at 65/100. Every name links to its own destination page, built exactly like this one. The full ranking →
What is Namibia particularly good at?
✓Energy, scored 5/5. Namibia is a very low emitter at about 1.1 tonnes per person in 2024, and its domestic generation leans on low-carbon sources, chiefly the Ruacana hydropower station plus fast-growing solar, together supplying around 40 per cent of home-produced electricity. The country imports much of its remaining power from South Africa's coal-heavy grid, which is its main indirect emissions burden. Policy ambition is high, with one of the more ambitious NDCs and a national Green Hydrogen Strategy aiming to make Namibia a major exporter of clean fuels. Abundant sun and wind underpin projects such as Hyphen that could reshape its energy future. Very low emissions and strong clean-energy ambition earn a high score, capped by reliance on imported coal power.
✓Culture, scored 5/5. Living Himba, San, Herero, Damara and Nama communities remain central to the country, and the communal conservancy model directs tourism and wildlife revenue to residents, a widely cited global example of community-based natural resource management.
✓Heritage, scored 5/5. Namibia is home to some of the oldest continuously living cultures on earth, and ancestral traditions remain strong. The San, including the Ju/'hoansi of Nyae Nyae, keep deep hunting and tracking knowledge and the healing or trance dance, one of the most closely documented Indigenous healing traditions in southern Africa. The OvaHimba maintain ancestor veneration around the holy fire and their distinctive ochre dress, while the OvaHerero hold Otjiserandu commemorations in their well-known Victorian-influenced attire. Nama and Damara communities keep the Nama-stap dance and riel, and Oshiwambo culture remains widely practised in the north. Living dance, music and ancestral spirituality run through daily life.
Where does Namibia score worst?
✕Recycling, scored 1/5. Formal recycling is limited, with kerbside schemes such as Rent-A-Drum operating in Windhoek but little collection nationally.
✕Plant-based eating, scored 2/5. Mahangu porridge, maize, beans and wild greens provide a plant-based base, but the food culture is strongly meat-centred around beef and game and dedicated plant-based options are limited outside the capital.
✕Organic farming, scored 2/5. Certified organic cropland is minimal and a national share could not be verified, but Namibia's wild-harvested Devil's Claw is certified organic and FairWild for export, giving it a genuine if narrow organic sector.
Similar countries doing it better and worse
TanzaniaScored on the same twelve pillars as Namibia.65
EthiopiaScored on the same twelve pillars as Namibia.70
UgandaScored on the same twelve pillars as Namibia.65
EgyptScored on the same twelve pillars as Namibia.57
BotswanaScored on the same twelve pillars as Namibia.53
SeychellesScored on the same twelve pillars as Namibia.53
A note from the lens of mother natureswipe →
Recycling, 1/5
Formal recycling is limited, with kerbside schemes such as Rent-A-Drum operating in Windhoek but little collection nationally.
Consequence: It is the lowest-scoring part of Namibia's record, so it is where the score moves first.
Plant-based eating, 2/5
Mahangu porridge, maize, beans and wild greens provide a plant-based base, but the food culture is strongly meat-centred around beef and game and dedicated plant-based options are limited outside the capital.
Organic farming, 2/5
Certified organic cropland is minimal and a national share could not be verified, but Namibia's wild-harvested Devil's Claw is certified organic and FairWild for export, giving it a genuine if narrow organic sector.
The Namibia Directory.
Everything on My Ideal World that sits in Namibia, checked and listed.
How the rest of the world scores Namibia
Independent global indices, for calibration.
Forest cover
9.8
World Bank, 2024.
Protected land
39.9
World Bank, 2025.
Protected sea
1.7
World Bank, 2025.
Renewable grid
40
Share of electricity SUPPLIED, not generated. The Namibia Statistics Agency records local generation at 55.4% of national demand, with the rest imported from South Africa, Zambia and Zimbabwe, and the split swinging with water levels at Ruacana. Domestic generation is almost entirely renewable, led by Ruacana hydro, but the grid a household actually draws on is far less so. Aggregators that report generation only put Namibia above 93%.
CO2 per person
1.2 t (2024)
World Bank, 2024.
Threatened species
144 (mammals, birds, fish & plants)
Recorded figure, sourced on this page.
Control of corruption
51.0 / 100
World Bank Worldwide Governance Indicators, 2025. Score from 0 to 100, where 100 is the strongest governance.
Government effectiveness
54.4 / 100
World Bank Worldwide Governance Indicators, 2025. Score from 0 to 100, where 100 is the strongest governance.
Rule of law
64.8 / 100
World Bank Worldwide Governance Indicators, 2025. Score from 0 to 100, where 100 is the strongest governance.
Political stability
78.6 / 100
World Bank Worldwide Governance Indicators, 2025. Score from 0 to 100, where 100 is the strongest governance.
Voice and accountability
64.6 / 100
World Bank Worldwide Governance Indicators, 2025. Score from 0 to 100, where 100 is the strongest governance.
Environmental Performance Index
42.8 / 100 · 77 of 177
Yale Environmental Performance Index 2026, ranked 77 of 177 countries assessed.
Ecosystem vitality
56.0 / 100 · 25 of 177
Yale Environmental Performance Index 2026, ranked 25 of 177 countries assessed.
Biodiversity and habitat
55.1 / 100 · 44 of 177
Yale Environmental Performance Index 2026, ranked 44 of 177 countries assessed.
Air quality
25.0 / 100 · 133 of 177
Yale Environmental Performance Index 2026, ranked 133 of 177 countries assessed.
Terrestrial biomes protected
100.0 / 100 · 1 of 177
Yale Environmental Performance Index 2026, ranked 1 of 177 countries assessed.
Marine habitat protected
0.0 / 100 · 96 of 111
Yale Environmental Performance Index 2026, ranked 96 of 111 countries assessed.
Where the numbers come from.
The institutions above are the ones cited on this page, ranked by how many of its figures they carry. This same sectioned page renders for all 77 scored destinations, each with its own researched history, comparison charts and three-way future. Read the full methodology
Every figure on this page, and where it came from: 75 sources across 30 institutions
World Bank18 FIGURES
Forest area (% of land area) AG.LND.FRST.ZS, 2023 check
Terrestrial protected areas (% of land area) ER.LND.PTLD.ZS, 2024 check
Marine protected areas (% of territorial waters) ER.MRN.PTMR.ZS, 2025 check
Threatened species (mammals EN.MAM.THRD.NO, birds EN.BIR.THRD.NO, fish EN.FSH.THRD.NO, higher plants EN.HPT.THRD.NO), 2022 check
PM2.5 air pollution mean annual exposure EN.ATM.PM25.MC.M3, 2023 check
Renewable electricity output (% of total) EG.ELC.RNEW.ZS, 2021 check
CO2 emissions per capita EN.GHG.CO2.PC.CE.AR5, 2024 check
Gyps africanus (White-backed Vulture), assessed 2021, Critically Endangered, Critically Endangered on the IUCN Red List, and recorded in Namibia in GBIF occurrence data (bird). check
A national figure is published: 14.2 micrograms per cubic metre, 2023 check
GBIF species profile for Lithops optica linked to its IUCN Red List assessment (iucnTaxonID 46790, category CRITICALLY_ENDANGERED), Critically Endangered on the IUCN Red List, and recorded in Namibia in GBIF occurrence data (plant). check
GBIF species profile for Lithops optica linked to its IUCN Red List assessment (iucnTaxonID 46790, category CRITICALLY_ENDANGERED) corroboration check
GBIF species profile for Lithops optica linked to its IUCN Red List assessment (iucnTaxonID 46790, category CRITICALLY_ENDANGERED) corroboration check
UNESCO Institute for Statistics4 FIGURES
public data API, indicator XGDP.FSGOV (government expenditure on education as a percentage of GDP), Namibia, Public spending on education runs at 9.1% of GDP and 24.6% of all government spending, and secondary enrolment check
public data API, indicator XGDP.FSGOV (government expenditure on education as a percentage of GDP), Namibia corroboration check
public data API, indicator XGDP.FSGOV (government expenditure on education as a percentage of GDP), Namibia corroboration check
public data API, indicator XGDP.FSGOV (government expenditure on education as a percentage of GDP), Namibia corroboration check
BirdLife International, IUCN and UNEP-WCMC3 FIGURES
UN SDG Global Database, terrestrial Key Biodiversity Areas covered by protected areas (%) ER_PTD_TERR, Namibia, 2025 (82.0%), country-reported check
UN SDG Global Database, marine Key Biodiversity Areas covered by protected areas (%) ER_MRN_MPA, Namibia, 2025 (83.0%), country-reported check
UN SDG Global Database, freshwater Key Biodiversity Areas covered by protected areas (%) ER_PTD_FRHWTR, Namibia, 2025 (86.3%), country-reported check
FAO, Global Forest Resources Assessment3 FIGURES
UN SDG Global Database, forest area (% of land area) AG_LND_FRST, Namibia, 2025 (9.8%), country-reported check
UN SDG Global Database, forest area under a long-term management plan (%) AG_LND_FRSTMGT, Namibia, 2025 (2.6%), country-reported check
UN SDG Global Database, forest area inside legally established protected areas (%) AG_LND_FRSTPRCT, Namibia, 2025 (20.9%), country-reported check
German Federal Government (Bundesregierung)3 FIGURES
Commemoration of the genocide of the Herero and Nama, Between 1904 and 1908 German colonial forces carried out the extermination of Herero and Nama people, recognis check
Commemoration of the genocide of the Herero and Nama corroboration check
Commemoration of the genocide of the Herero and Nama corroboration check
UN Human Rights Council3 FIGURES
Report of the Special Rapporteur on the rights of indigenous peoples, James Anaya: The situation of indigenous peoples in Namibia, A/HRC/24/41 Addendum, 25 April 2013, Namibia is home to some of the oldest continuously living cultures on earth, and ancestral traditions remain s check
Report of the Special Rapporteur on the rights of indigenous peoples, James Anaya: The situation of indigenous peoples in Namibia, A/HRC/24/41 Addendum, 25 April 2013 corroboration check
Report of the Special Rapporteur on the rights of indigenous peoples, James Anaya: The situation of indigenous peoples in Namibia, A/HRC/24/41 Addendum, 25 April 2013 corroboration check
Environmental Investment Fund of Namibia (EIF)2 FIGURES
New era for waste management as plastic carrier bags banned from protected areas, 22 November 2018, Plastic bags banned in national parks and protected areas, no full national ban yet. check
New era for waste management as plastic carrier bags banned from protected areas, 22 November 2018 corroboration check
Low Carbon Power2 FIGURES
Namibia electricity mix (about 40% low-carbon, heavy net imports), 2023 check
Forestry and Tourism (MEFT), Namibia, Minister's statement at the commemoration of World Rhino Day, 22 September 2023, Enforcement supports custodianship of the largest free-roaming black rhino population, while marine cover is a check
Forestry and Tourism (MEFT), Namibia, Minister's statement at the commemoration of World Rhino Day, 22 September 2023 corroboration check
NamibRand Nature Reserve2 FIGURES
Dark Sky, NamibRand Nature Reserve is certified as a Gold Tier International Dark Sky Reserve by the International Dark- check
Red List Categories and Criteria: Version 3.1, Second edition, Critically Endangered, the last IUCN category before Extinct in the Wild, and still recorded in Namibia. check
Namibia Ministry of Environment1 FIGURE
Forestry and Tourism, national protected-area and wildlife authority check

 TanzaniaScored on the same twelve pillars as Namibia.65
 EthiopiaScored on the same twelve pillars as Namibia.70
 UgandaScored on the same twelve pillars as Namibia.65
 EgyptScored on the same twelve pillars as Namibia.57
 BotswanaScored on the same twelve pillars as Namibia.53
 SeychellesScored on the same twelve pillars as Namibia.53