Destinations › Africa · The Destination Index · universal template · every figure sourced
Tanzania.
Eastern Africa, bordering the Indian Ocean, between Kenya and Mozambique. 947,300 sq km and 70,545,865 people, 1,424 km of coastline, varies from tropical along coast to temperate in highlands.
Region · AfricaPopulation · ~70,545,865Languages · Swahili (official), English, Sukuma, Chagga, Haya, and over 120 languages in allEco Index · 65/100 · Passable
The Eco Index across 12 pillars · scored 0 to 5 · World Bank, OWID, WHO/UNICEF JMP, FiBL, Protected Planet, IUCN, UNESCO (2023-24)
Water
Food & farming
Plant-based
Organic
Conservation
Wildlife
Materials
Pollution
Recycling
Energy
Culture
Heritage
The History of Tanzania.
Tanzania holds a rich living heritage. On the Swahili coast and in Zanzibar, taarab, popularly known as Swahili wedding music, remains an essential part of festivities that run over several days, and UNESCO has backed work to keep it taught in rural Unguja and Pemba.
Where the name comes from
A compound made at union in 1964 from Tanganyika and Zanzibar. Source: national and regional toponymic records.
The land itself: plains along the coast, a central plateau, and highlands to the north and south. Its high point is Kilimanjaro, 5,895 m. Source: national mapping and survey records.
Where it starts
The earliest footprints on Earth
At Laetoli, three early humans walked across the same volcanic surface 3.66 million years ago and left their footprints behind. Found in 1978 and attributed to Australopithecus afarensis, they are the earliest hominin footprints known in the world. Nearby Olduvai Gorge, a ravine 14 km long, holds a sequence of evolving hominin species from Zinjanthropus boisei to Homo habilis, Homo erectus and Homo sapiens.
How it got here
Kilwa, which minted its own money
Kilwa Kisiwani was settled in the 9th century and grew into a Swahili port city, built of coral and lime mortar, that reached its peak in the 13th and 14th centuries. Between the 11th and 14th centuries Kilwa minted its own currency, and its merchants controlled Indian Ocean trade, sending out gold and ivory from the hinterland and taking in silver, carnelians, perfumes, Persian faience and Chinese porcelain. In the 16th century the Portuguese built a fort on the island and its decline began.
The timeline
3.66 million years ago
The Laetoli footprints.
Three early humans walked across a volcanic surface at Laetoli and left the earliest hominin footprints known in the world. Found in 1978, they are attributed to Australopithecus afarensis. ↗
Millions of years ago
Olduvai Gorge.
Olduvai Gorge, a ravine 14 km long, holds a sequence of evolving hominin species, from Australopiths such as Zinjanthropus boisei to Homo habilis, Homo erectus and Homo sapiens. ↗
9th century
Kilwa Kisiwani is founded.
People settle Kilwa Kisiwani, which grows into a Swahili port city and one of the great trading ports of the East African coast. ↗
11th to 14th centuries
Coral stone and coins.
Kilwa Kisiwani mints its own currency, and its Great Mosque, built in the 11th century of coral and lime mortar, is later enlarged and roofed with domes and vaults. ↗
11th to 14th century
Kilwa mints its own currency.
The city mints its own coins, and its wealth rests on control of Indian Ocean trade, sending gold and ivory from the hinterland out in exchange for silver, carnelians, perfumes, Persian faience and Chinese porcelain. ↗
13th to 14th century
Kilwa's height.
The city reaches its peak, with mosques and palaces whose ruins still stand. ↗
16th century
Portuguese fort.
The Portuguese build a fort on Kilwa Kisiwani, and the decline of the island ports begins. ↗
1961 and 1964
Independence and union.
Tanganyika joins the United Nations as an independent state in December 1961, and Zanzibar in December 1963. The two unite in April 1964 and take the name Tanzania that November. ↗
1981
World Heritage.
The ruins of Kilwa Kisiwani and Songo Mnara are inscribed by UNESCO. ↗
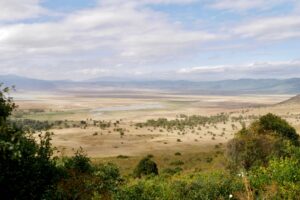
Almost 40% of Tanzania's land is protected (World Bank, 2025), among the largest protected estates on Earth, spanning the Serengeti, the Ngorongoro Conservation Area, Nyerere (Selous) and Ruaha, and these parks are actively managed and funded through tourism. Marine protection is far lower at about 2.3%, and some protected-area management has drawn criticism over community evictions.
Is wild Tanzania protected? 39.9% of the land is, already past the 30% target for 2030
How protected is nature in Tanzania?
Forest cover50.1%
Terrestrial protected area39.9%
Marine protected area2.3%
1320 (mammals, birds, fish & plants) listed as threatened.
Found only here. Zanzibar red colobus, the Kipunji (a monkey genus found only here), Pemba flying fox and Udzungwa and Usambara forest species.
The watchlist
ThreatenedErythrocebus baumstarkiCritically Endangered on the IUCN Red List, and recorded in Tanzania in GBIF occurrence data (mammal).
ThreatenedGyps africanusCritically Endangered on the IUCN Red List, and recorded in Tanzania in GBIF occurrence data (bird).
ThreatenedCrevice Tortoise (Malacochersus tornieri)Critically Endangered on the IUCN Red List, and recorded in Tanzania in GBIF occurrence data (turtle).
ThreatenedMatilda's Horned Viper (Atheris matildae)Critically Endangered on the IUCN Red List, and recorded in Tanzania in GBIF occurrence data (reptile).
ThreatenedNguru Warty Frog (Callulina meteora)Critically Endangered on the IUCN Red List, and recorded in Tanzania in GBIF occurrence data (amphibian).
ThreatenedStreptocarpus kimbozanusCritically Endangered on the IUCN Red List, and recorded in Tanzania in GBIF occurrence data (plant).
ThreatenedDiceros bicornisCritically Endangered on the IUCN Red List, and recorded in Tanzania in GBIF occurrence data (mammal).
ThreatenedRuppell's griffon (Gyps rueppellii)Critically Endangered on the IUCN Red List, and recorded in Tanzania in GBIF occurrence data (bird).
Critically Endangered, the last IUCN category before Extinct in the Wild, and still recorded in Tanzania. GBIF holds 2 verified occurrence records.
Gyps africanus
Critically Endangered, the last IUCN category before Extinct in the Wild, and still recorded in Tanzania. GBIF holds 222 verified occurrence records.
Crevice Tortoise (Malacochersus tornieri)
Critically Endangered, the last IUCN category before Extinct in the Wild, and still recorded in Tanzania. GBIF holds 10 verified occurrence records.
Matilda's Horned Viper (Atheris matildae)
Critically Endangered, the last IUCN category before Extinct in the Wild, and still recorded in Tanzania. GBIF holds 2 verified occurrence records.
Species named here are drawn from GBIF occurrence records for Tanzania filtered to the IUCN Red List threatened categories. Species are listed where GBIF holds occurrence records for them in this country. Record counts are not published here because the figure cannot be reproduced from a public GBIF query.
National park in Kilimanjaro, mapped and named in the open record for Tanzania. OpenStreetMap.
Water and Ocean in Tanzania.
Tanzania borders three of Africa's great lakes, Victoria, Tanganyika and Nyasa, and has major rivers such as the Rufiji and Pangani, so surface freshwater is vast. Yet only about 31% of people have safely managed drinking water (World Bank, 2024), rural and dry-region access is poor and many households rely on distant or unsafe sources.
Does Tanzania have enough fresh water? Yes, with headroom
31.3% of people here have safely managed drinking water at home (2024, WHO/UNICEF JMP). Coverage is well short of universal, so a visitor should not assume the tap is safe.
Cleanest water: Crater lakes and highland streams, such as Lake Chala near Kilimanjaro.
How much fresh water does Tanzania have, per person?
1,298 m³
Tanzania
1,000 m³
the UN “water scarce” line
Tanzania withdraws about 5,184 million cubic metres of fresh water a year (2022). That is 13.0% of the fresh water actually available to it, which FAO counts as low water stress. Of what is taken, farming takes 89%, homes and towns 10%, industry 0%. Source: FAO AQUASTAT.
What are the rules on Tanzania beaches?
✕Tap water: Not drinkable.
✓Plastic rules: Yes: a strict nationwide plastic-bag ban since 2019, enforced even on arriving travellers..
✕Solo travel: rated take care on the record for this destination.
✕Marine protection: 2.3% of the sea is protected. The 30x30 pledge for 2030 is not met yet.
Named on the open map: Isabel Beach, Muyuni Beach, Nakupenda Beach, Jimbizi beach, Kanga beach. That is 5 named beaches in the public record for Tanzania, each one a place you can look up before you go. OpenStreetMap.
Where does the sewage go?
28.5%
of people have safely managed sanitation
28.5% of people here use a safely managed sanitation service, meaning waste is contained, emptied and treated rather than reaching the ground or the sea untreated (2024, World Bank / WHO-UNICEF JMP, SDG 6.2.1). The rest is what the rivers and the coast receive.
How is the sea around Tanzania doing?
One cross-section, every answer measured.
Surface
What the coast carries
Dry Jun–Oct for safari; the short rains Nov–Dec; Zanzibar is fine year-round.
Nearshore
Protected water
2.3% of territorial waters are protected, against the 30% pledged for 2030 under the Global Biodiversity Framework.
Cleanest
Where the water is cleanest
Crater lakes and highland streams, such as Lake Chala near Kilimanjaro..
The record
Measured
Tanzania borders three of Africa's great lakes, Victoria, Tanganyika and Nyasa, and has major rivers such as the Rufiji and Pangani, so surface freshwater is vast. Yet only about 31% of people have safely managed drinking water (World Bank, 2024), rural and dry-region access is poor and many households rely on distant or unsafe sources.
Tanzania scored 74 out of 100 on the Ocean Health Index in its 2025 assessment, above the global average of 72, and ranked 72nd of 220 coastal regions. The index team says it is no longer updating scores, so the 2025 figures may be the last.
Sea protected
2.3%
Against the 30% pledged for 2030 under the Global Biodiversity Framework.
Threatened species
1320 (mammals, birds, fish & plants)
Mammals, birds, fish and higher plants on the IUCN list.
Is the tap water safe in Tanzania?
31.3% of people have safely managed drinking water at home (2024, WHO/UNICEF JMP). Renewable fresh water works out at about 1,298 cubic metres per person a year (World Bank).
How hard is the water supply being pushed?
Of every 10 buckets nature refills, 1 are already taken. Withdrawals run at 13% of what Tanzania renews internally each year (2022, World Bank / FAO AQUASTAT). That is inside the 25% mark generally treated as water stress, so the supply has headroom.
When is the best time to visit Tanzania? Tap your month.
Tap your month.
JanFebMarAprMayJunJulAugSepOctNovDec
.
How much fresh water does Tanzania actually have?
Nature renews about 1,298 cubic metres of fresh water per person per year here. That ranks Tanzania 69 of 208 countries measured, putting it in the drier half of the world. The UN treats anything under 1,000 cubic metres as water scarce, and this is above that line. World Bank / FAO AQUASTAT.
Agriculture employs most of the workforce, about 64.6% of all jobs in 2025 (World Bank). Maize is the main crop, with 2026 output forecast at 7.3 million tonnes, alongside an above average paddy rice harvest (FAO GIEWS). Food made up only about 8.2% of merchandise imports in 2025, so the farm economy is dominant.
Where does the food in Tanzania come from?
9.2% imported
about US$1,362m a year
On the plate: Ugali (maize), rice, beans, cassava, plantain, leafy greens (mchicha) and coconut on the coast.
How often each food is on the plate
Share of people eating each one regularly. These overlap, so they do not add up to 100%.
Maize29%
Cassava12%
Rice12%
Beans5%
1 of 10
bites are imported
Tanzania buys in more food energy than it eats. About US$1,362m a year leaves the country to pay for it. The green slice is roughly what still grows here.
Food is 9.2% of everything Tanzania imports (2024, World Bank). Farming itself is 22.9% of the economy and 44.6% of the land is agricultural, of which 15.2% is arable. The green slice is roughly what still grows here.
What is killing people in Tanzania? The imported diet.
Cause of death, and the diet behind it.
Non-communicable diseases, all combined38.8%
Diabetes9.8%
There is no national count. At Kilimanjaro Christian Medical Centre in Moshi, 31 of 60 people treated for diabetic foot ulcers between September 2018 and March 2019 had a major limb amputation, more than half. Source: BMC Surgery, 2021.
Adults living with overweight or obesity. 32.2%.
Can Tanzania feed itself?
15.5%
Arable land
44.6%
Agricultural land
21,988,409
Farmers
33,365,353
Arable acres
22.9%
Agriculture, share of GDP
Harvest: Main cereal harvest around June to August after the long rains; coffee May to October.
Feeding itself
Agriculture employs most of the workforce and Tanzania is broadly self-sufficient in staples such as maize, cassava, bananas and rice, while exporting cashews, coffee and cotton. No verified import figure was found, and wheat, sugar and palm oil are imported, but the farm economy is dominant.
Certification
About 0.5% of agricultural land is certified organic (FiBL, 2020 data), though a large share of smallholder farming is de facto low-input and uncertified.
Water for crops
Tanzania borders three of Africa's great lakes, Victoria, Tanganyika and Nyasa, and has major rivers such as the Rufiji and Pangani, so surface freshwater is vast. Yet only about 31% of people have safely managed drinking water (World Bank, 2024), rural and dry-region access is poor and many households rely on distant or unsafe sources.
Why the organic number looks like that. Certification covers only part of what is grown cleanly, so a small certified share is a gap in the paperwork rather than proof that nothing is. What the official land record does show: 44.6% of the country is agricultural land and 15.2% is arable (2023, World Bank). Certification is paid for per farm per year by a foreign body, which prices out smallholders, so the organic number reads worse than the practice.
The plant-based kitchen here is not an import. By tonnage, the largest crops grown in Tanzania are cassava, maize, rice, sugarcane and bananas (FAO, FAOSTAT crop production, 2024). That is what the land itself puts on a plate.
Buy direct where residents buy: Chake Chake Market, Chief Kingalu Market., Fish Market سوق السمك, Handeni Market, Iringa Maasai Market, Kalenge Market. Each is a mapped, named marketplace, so the money stays with the seller rather than the importer. OpenStreetMap.
Not yet checked by us. Plant based kitchens listed publicly: Kind Earth Eatery, vegetarian restaurant in Dar es Salaam: organic and raw food, about 80 per cent of dishes vegan or made vegan, no meat cooked on site; Mlima Sayuni Art and Vegetarian Restaurant, vegetarian restaurant in Dar es Salaam using produce from the owner's garden, order a day ahead; Swastik Pure Vegetarian, vegetarian restaurant in Dar es Salaam with vegan Indian, Italian and Indochinese dishes; Tast Bites, vegetarian Bombay street food in Dar es Salaam, mostly vegan, cash only; Rohobot Ethiopian, Ethiopian restaurant in Dar es Salaam with many vegan stews of lentils, chickpeas and beans. Tell us how they are.
Tanzania is one of the world's lowest per-capita emitters, at roughly 0.31 tonnes of CO2 per person, reflecting low industrialisation and limited electricity access. Its grid has shifted decisively towards hydropower since the 2,115 MW Julius Nyerere plant began generating, so that hydro now provides the majority of installed capacity, about 59% at the end of 2024, with natural gas the main second source at around 35%. The government's National Energy Compact and Nationally Determined Contribution aim to expand renewables and grid access, and hydro's share of generation has risen further through 2025. Very low emissions and a now hydro-led grid earn a high band, but continued and expanding natural-gas dependence, plus planned LNG development, hold it just below the top.
What powers Tanzania?
Renewable 32.9%Fossil 67.1%
The grid belongs to the Tanzania Electric Supply Company, TANESCO, which is run by the state. Private power producers have been allowed into generation, but transmission and distribution have stayed under TANESCO's control. The regulator is the Energy and Water Utilities Regulatory Authority, EWURA, which describes itself as an autonomous authority set up under the EWURA Act, Cap 414, covering electricity, petroleum, natural gas and water. In June 2025 the energy ministry's permanent secretary said the government would open transmission projects to private investment for the first time, starting with one or two pilot projects, with the International Finance Corporation helping to prepare tenders. In July 2025 a columnist in The Citizen referred to Cabinet approval of private participation in transmission, while noting that generation, transmission and distribution all still sit within the one loss making company.
Climate pollution per person
The safe amount, what the planet can absorb
2 tonnes
One person here
0.31 tonnes
The world average, for comparison
4.7 tonnes
The worst it ever got
0.31 tonnes
The grid
Tanzania is one of the world's lowest per-capita emitters, at roughly 0.31 tonnes of CO2 per person, reflecting low industrialisation and limited electricity access. Its grid has shifted decisively towards hydropower since the 2,115 MW Julius Nyerere plant began generating, so that hydro now provides the majority of installed capacity, about 59% at the end of 2024, with natural gas the main second source at around 35%.
Pollution
Tanzania enforces a strict ban on plastic carrier bags across Mainland Tanzania, introduced on 1 June 2019 and now made under the Environmental Management (Prohibition of Plastic Carrier Bags and Plastic Bottle Cap Seals) Regulations, 2022, and checked even on arriving travellers. Air quality is moderate at about 18 micrograms of fine particles per cubic metre (AQLI, 2022), driven by biomass cooking and dust, and other waste litter persists.
Water stress
Tanzania borders three of Africa's great lakes, Victoria, Tanganyika and Nyasa, and has major rivers such as the Rufiji and Pangani, so surface freshwater is vast. Yet only about 31% of people have safely managed drinking water (World Bank, 2024), rural and dry-region access is poor and many households rely on distant or unsafe sources.
What pollutes most here
1The gridThe share of electricity still generated from fossil fuel.62.8%
2IndustryCharcoal-driven deforestation, and illegal dynamite fishing that wrecks coastal reefs..named
3AirModelled annual mean against a WHO guideline of 5 µg/m³.18.2
4On the recordTanzania enforces a strict ban on plastic carrier bags across Mainland Tanzania, introduced on 1 June 2019 and now made under the Environmental Management (Prohibition of Plastic Carrier Bags and Plastic Bottle Cap Seals) Regulations, 2022, and checked even on arriving travellers.
What has Tanzania promised on climate?
Electricity renewable today37.2% (2021)
Land protected, against a 30% target39.9% by 2025
Sea protected, against a 30% target2.3% by 2025
Measured on delivery, 37.2% of electricity is already renewable (2021, World Bank), so 62.8% of the grid is still to be converted. The pledge on file is measured here against what has actually been delivered, not taken on its own (UNFCCC NDC Registry, CBD Kunming-Montreal Target 3).
The biggest line item
One return flight against a whole year of living.
A resident's entire year0.31 t CO2e
Safe-climate budget, per year2 t CO2e
Los Angeles return, economy2.92 t CO2e
New York return, economy2.24 t CO2e
Sydney return, economy2.08 t CO2e
London return, economy1.35 t CO2e
Singapore return, economy1.3 t CO2e
How much CO2 does flying to Tanzania emit?
Tap where you would fly from. One return flight, economy.
Los AngelesNew YorkSydneyLondonSingapore
.
Firsts on climate finance. The Citizen describes CRDB Bank's Kijani Bond as the first green bond of its kind in Tanzania. It has a face value of TSh 171.8 billion, the equivalent of US$65.7 million, and was listed on the Luxembourg Stock Exchange on 30 June 2025. On 22 February 2024 the Tanga water utility, Tanga UWASA, issued a 10 year green bond worth TSh 53.12 billion, which the UN Capital Development Fund calls a first of its kind subnational water green bond in Tanzanian and East African history. It is meant to raise Tanga's daily water supply from 45,000 to 60,000 cubic metres, reaching about 26,000 more people.
Every prompt runs on a machine in a building on somebody’s grid. What that costs the planet depends less on the prompt than on what is burning to power it. Here is what would power one in Tanzania.
Data centres
15
Registered colocation and interconnection facilities, PeeringDB, 2026
Grid renewable
32.9 %
What a machine here runs on.
What powers a data centre in Tanzania?
Most of the power behind a machine here is still burned.
Renewable 32.9%Fossil 67.1%
Cooling water. Every one of those halls runs on the national grid, which is 37.2% renewable today (World Bank). A data centre is only as clean as the electricity behind it, so the same figure that decides this country's climate score also decides the footprint of the AI running inside it. Cooling water use is not separately published by facility, and no operator here reports it.
The rules. Tanzania has 15 colocation and interconnection facilities on the public PeeringDB register, concentrated in Dar es Salaam (9), Arusha (1), Mwanza (1), alongside 7 internet exchanges (TIX Tanzania, Dar es Salaam, TIX Tanzania, Arusha (AIXP), TIX Tanzania, Mwanza, TIX Tanzania, Zanzibar). Named sites include SEACOM Dar Es Salaam CLS, TIX - Tanzania, Posta House, Zantel, STELLAR IX SALASALA DataCenter.
Where the cables land. 2 landing points · Dar Es Salaam, Mtwara
98% residents to 2% visitors across a year. 1,527,000 international arrivals in 2019 against 70,545,865 people who live here (2025, World Bank / UN Tourism).
Where a visitor dollar goes in Tanzania
1,527k
Visitors a year
0.0
Visitors per resident
How deep in debt is Tanzania?· for every $100 Tanzania earns in a year, it owes…
Pay to the order of: the creditorsmemo · today
$ 49What is owed now, for every $100 of national income (2026).
IMF World Economic Outlook, 2026signed, the creditors
Pay to the order of: the creditorsmemo · projected 2031
$ 43The IMF's own forecast has this falling to $43 by 2031.
IMF World Economic Outlook projection, 2031signed, the forecast
For every $100 Tanzania earns in a year, it owes $49 (2026, IMF World Economic Outlook). The interest on that is paid before schools, clinics or coastline get their turn.
Where does a tourist dollar actually go in Tanzania?
Play one tourist dollar around the board. Every square is a measured fact from this page.
START!
1
GO: a visitor lands
$100 goes on the table. 1,527,000 international arrivals in 2019 against 70,545,865 residents, one visitor a year for every 46 residents (World Bank / UN Tourism).
$100 in play
2
The bed
Who owns the largest places to stay in Tanzania is not published in the records we can check, so this square is left open rather than guessed. Where a listing names its owner, it is shown in the ownership table below.
not published
3
The plate
Food is only 9.2% of everything Tanzania imports (2024, World Bank), so most of a meal is bought from producers inside the country. Eating what the land here actually grows, maize, cassava, sweet potatoes, bananas, sugarcane, rice, vegetables, beans, sunflower seeds, keeps that money with the grower.
mostly home-grown
4
The power
62.8% of the electricity is fossil (2021, World Bank). Lighting, cooling and hot water are paid for largely in imported fuel.
burns away
5
What actually stays
On the parts that can be measured, the power leaves and the plate stays. It is genuinely a coin toss, decided by what you book.
split
6
Pay the bank first
Tanzania owes $49 for every $100 it earns (IMF World Economic Outlook, 2026 projection). The interest is paid before anything else on this board.
$49 per $100
7
No plan B
43.2% of everything Tanzania sells abroad is pearls, gemstones and precious metals (2023, UN Comtrade). One market moving takes the whole board with it.
43.2% one export
8
Community chest
Tourism earns 27.2% of everything Tanzania makes from exports (2019, World Bank / UN Tourism). That is how much of the economy depends on the game continuing.
27.2% of exports
9
The flight
Getting here is usually the biggest single line on the bill. From Los Angeles a return economy seat is 2.92 t CO2, on the UK Government's published conversion factors. It is the one part of the trip this board cannot reduce.
2.92 t CO2
10
Back to GO
The economy turns over about US$95 billion a year (IMF World Economic Outlook, 2026 projection). Every lap of this board is a choice about how much of it stays.
US$95bn
GDPUS$90.1bn
Agriculture, share of GDP22.9%
Visitors a year1,527,000
Visitors per resident0
Residents~70,545,865
Agriculture
Farming is 22.9% of the economy. Agriculture employs most of the workforce and Tanzania is broadly self-sufficient in staples such as maize, cassava, bananas and rice, while exporting cashews, coffee and cotton.
Natural materials
Tanzania was historically the world's largest sisal producer and still grows sisal and cotton, while kanga and kitenge cloth are worn daily and Tanzania was historically the world's largest sisal producer and still grows sisal and cotton, while kanga and kitenge cloth remain part of everyday dress..
Energy
Tanzania is one of the world's lowest per-capita emitters, at roughly 0.31 tonnes of CO2 per person, reflecting low industrialisation and limited electricity access. Its grid has shifted decisively towards hydropower since the 2,115 MW Julius Nyerere plant began generating, so that hydro now provides the majority of installed capacity, about 59% at the end of 2024, with natural gas the main second source at around 35%.
Who owns the biggest hotels in Tanzania?
By rooms · company records and press.
Upepo Safari · ~5 roomsIndependentnot published
Emerson Spice Tanzania · ~11 roomsIndependentnot published
MamboViewPoint · ~12 roomsIndependentnot published
Savera Beach Houses · ~4 roomsIndependentnot published
Upepo Beach Garden · ~5 roomsIndependentnot published
Greystoke Mahale · ~6 roomsIndependentnot published
Visitors, over time
20141,140k
20151,137k
20161,284k
20171,327k
20181,506k
20191,527k
International tourism receipts run at about US$2.62 billion in 2019 (World Bank / UN Tourism). That is 27.2% of everything the country earns from exports.
How much of your money actually stays here?
Tap the holiday you are planning.
All-inclusive resortForeign-owned hotel and tourist restaurantsLocally owned stay and local restaurantsGuesthouse, markets and public transport
Resort guest, villa renter, family, nomad or backpacker. The honest playbook for each, from the same sourced numbers.
Already booked a resort? · the rescue list
Practical swaps that keep more of your money in the local economy
1. Eat where the country eats Choose kitchens cooking ugali (maize), rice, beans, cassava, plantain, leafy greens (mchicha) and coconut on the coast. over imported menus. The checked list →
2. Book with a local operator Never the lobby desk. The margin on a tour is the part that stays.
3. Stay somewhere locally owned Ownership decides where the room rate books. Eco stays →
4. Use the transport residents use Domestic flights and safari 4x4s link the parks; ferries connect Dar es Salaam with Zanzibar.
5. Buy the craft, not the souvenir Natural-materials work made here pays the maker directly; imported gifts pay a shipping line.
swipe →
First time here
Tanzania holds one of Earth's largest protected estates and richest wildlife, alongside low water-safety and waste infrastructure.
Best time: The dry season for safari and Kilimanjaro treks, with river crossings of the migration around July to September.
Getting around
Domestic flights and safari 4x4s link the parks; ferries connect Dar es Salaam with Zanzibar.
Transport is where the fare either stays or leaves.
Eating here
The everyday plate is ugali (maize), rice, beans, cassava, plantain, leafy greens (mchicha) and coconut on the coast.. The everyday diet is built on ugali (maize), rice, beans, cassava, plantain, leafy greens (mchicha) and coconut on the coast, so unprocessed plant eating is the affordable default.
Eating what the country grows is the cheapest way to cut the import bill.
Good to know
Cash everywhere, cards in cities; TZS. Carry small notes for villages.
None of the 6 properties listed here publishes who ultimately owns it, so no claim is made either way. Ownership is what decides how much of a room rate stays in the country, which is why we show it when a listing states it.
Society and Governance in Tanzania.
How well is Tanzania actually run?
Governance, measured · World Bank WGI
Four measured answers, none of them opinion. Averaged across corruption control, delivery and accountability, Tanzania scores 44 out of 100 (2024, World Bank Worldwide Governance Indicators). That matters here because every pledge on this page is only as good as the machinery meant to deliver it.
How well is Tanzania run? · each scored out of 100, higher is better
Clean government, scored 42 of 100
Control of corruption scores 41.9 out of 100 (2024, World Bank Worldwide Governance Indicators). That is below the halfway mark of governments measured.
42
Freedom and rights, scored 43 of 100
Voice and accountability, which measures free expression, free media and the ability to choose a government, scores 43.3 out of 100 (2025, World Bank WGI). Citizens have some room to question their government.
43
Government effectiveness, scored 47 of 100
Government effectiveness, which measures the quality of public services and how well policy is actually delivered, scores 47.1 out of 100 (2025, World Bank WGI). Delivery is rated below average, so a pledge on paper is not the same as a pledge kept.
47
Income equality, scored 41 of 100
The Gini index of income inequality reads 40.5 (2018, World Bank). Zero is perfect equality and 100 is one person holding everything. Above 40 is the level usually treated as socially strained, and Tanzania sits above it.
41
LGBTQ+ status: IllegalSolo female travel: Take care78.2% adult literacyIndustry to avoid: Charcoal-driven deforestation, and illegal dynamite fishing that wrecks coastal reefs.
What is daily life in Tanzania really like? Measured
Getting around, breathing, throwing away, learning. The honest checklist.
TransportAirWaterWastePower
✓How you get around Domestic flights and safari 4x4s link the parks; ferries connect Dar es Salaam with Zanzibar.
✓Air quality, measured Modelled annual mean 18.2. The WHO guideline is 5 µg/m³.
✓Where the air is cleanest Highland areas such as the slopes of Kilimanjaro and the Southern Highlands.
·Tap water Not drinkable
✓What to drink Bottled water; Zanzibar and the coast are strictly bottled.
✓Plastic rules Yes: a strict nationwide plastic-bag ban since 2019, enforced even on arriving travellers.
✓Sockets and voltage Type C/D/M, 230V
78.2%
literacy. Public spending on education runs at 3.2% of GDP and 13.4% of all government spending, and secondary enrolment stands at 28.2% gross (UNESCO Institute for Statistics, 2021 to 2024).
Made in Tanzania.
Tanzania was historically the world's largest sisal producer and still grows sisal and cotton, while kanga and kitenge cloth are worn daily and Tanzania was historically the world's largest sisal producer and still grows sisal and cotton, while kanga and kitenge cloth remain part of everyday dress.. Every step of processing done at home is value that stops leaving the country.
What Tanzania actually sells the world
The single biggest thing Tanzania sells the world is pearls, gemstones and precious metals, 43.2% of all exports in 2023 (about US$3.14 billion, UN Comtrade). The next four are oil seeds and oleaginous fruit at 5.4%, tobacco at 5.2%, vegetables at 4.4%, coffee, tea and spices at 4.0%.
Made now · natural materials
Still grows sisal
Worked in Tanzania from local material, and still a working craft rather than a museum piece.
Made now · natural materials
Cotton
Worked in Tanzania from local material, and still a working craft rather than a museum piece.
Made now · natural materials
Maasai beadwork
Worked in Tanzania from local material, and still a working craft rather than a museum piece.
Made now · natural materials
Basketry remain living crafts
Worked in Tanzania from local material, and still a working craft rather than a museum piece.
Buys in · 12.1% of imports
Machinery and mechanical appliances
Tanzania imported US$1.83 billion of machinery and mechanical appliances in 2023, 12.1% of everything it bought abroad, and sells none of it back. Every point of that is a business that could be built at home rather than shipped in. UN Comtrade.
Buys in · 10.7% of imports
Vehicles
Tanzania imported US$1.62 billion of vehicles in 2023, 10.7% of everything it bought abroad, and sells none of it back. Every point of that is a business that could be built at home rather than shipped in. UN Comtrade.
Buys in · 6.3% of imports
Electrical machinery and electronics
Tanzania imported US$0.96 billion of electrical machinery and electronics in 2023, 6.3% of everything it bought abroad, and sells none of it back. Every point of that is a business that could be built at home rather than shipped in. UN Comtrade.
Buys in · 5.1% of imports
Iron and steel
Tanzania imported US$0.78 billion of iron and steel in 2023, 5.1% of everything it bought abroad, and sells none of it back. Every point of that is a business that could be built at home rather than shipped in. UN Comtrade.
The maths for an entrepreneur. Tanzania produces about US$90 billion a year, which is roughly US$1,278 per person (2025, World Bank). Farming is 22.9% of that, while food is 9.2% of everything the country imports. With 15.2% of the land arable, the raw material for that is already in the ground.
Maasai men perform this jumping dance, and the higher a man can leap, the stronger he is held to be.
At weddings and other festivities that run over several days.Taarab music of ZanzibarA traditional form of Swahili musical expression, popularly known as Swahili wedding music.
Does Tanzania protect its heritage by law?
Partly, and the gaps say as much as the protections.
What is kept alive. Tanzania holds one of Africa's richest living heritages, spread across more than 120 ethnic groups. Ngoma drumming and dance underpin community life, the Maasai perform the adumu jumping dance, and the Swahili coast and Zanzibar sustain taarab, a fusion of African, Arab and Indian music. Ancestral and spiritual traditions remain strong, from Maasai and Sukuma ceremony to Swahili Islamic practice, and the country is home to some of the last hunter-gatherer peoples, the Hadzabe with their click language and the Datoga, alongside the Maasai and Iraqw.
Who it belongs to. More than 120 ethnic groups keep living cultures, from the Maasai and the hunter-gatherer Hadzabe to the Chagga and the Swahili coast, and community tourism and Wildlife Management Areas channel some income locally. Much safari revenue still leaks to foreign operators, and protected-area evictions have hurt communities such as the Maasai.
Only here. Mount Kilimanjaro, Africa's highest peak and the world's tallest free-standing mountain..
Three futures for Tanzania, every one run forward from measured data.
Where the making actually happens
Named cultural and craft sites on the open map: National Museum of Tanzania (Dar es Salaam), Olduvai Gorge Museum (Arusha), Sukuma Museum (Mwanza Region), Museum Road (Kelele Square), King George V Memorial Museum (Dar es Salaam). OpenStreetMap. Named craft workshops on the open map: Arts and Creativity, BITCOIN SAFARI ART SHOP, Fundi Vyuma, Jambo Gallery, KWA SAPRO MASAI, Kotecha.
Every measured trend on one line
Run forward at the pace already recorded.
-22%
Forest cover
1995: 63.4% → 2024: 49.6%
-53%
Renewable electricity
1995: 80% → 2021: 37.2%
+222%
CO2 per person
1995: 0.097 t → 2024: 0.31 t
+418%
Tourist arrivals
1995: 295k → 2019: 1,527k
+25%
Protected land
2013: 31.9% → 2025: 39.9%
-13%
Farm workforce
1995: 74.1% → 2025: 64.6%
-23%
Protected sea
2013: 3% → 2025: 2.3%
+21%
Agricultural land
1995: 37.3% → 2024: 45.1%
+80%
Urban population
1995: 20.5% → 2025: 36.9%
+24%
Air pollution
1995: 16.3 µg/m³ → 2023: 20.2 µg/m³
-53%
Fresh water per person
1995: 2,765 m³ → 2022: 1,298 m³
+144%
Adult overweight
1995: 13.2% → 2022: 32.2%
+1127%
Electricity access
1995: 4.27% → 2024: 52.4%
+410%
GDP per person
1995: 258 → 2025: 1,319
+132%
Population
1995: 30,383k → 2025: 70,546k
-16%
Renewable energy use
1995: 93.3% → 2021: 78.3%
+7%
Energy per person
1995: 363 kg → 2024: 389 kg
+24%
Protected area, total
2013: 26% → 2025: 32.3%
+32%
Life expectancy
1995: 51 yrs → 2024: 67.2 yrs
+10%
Cereal yield
1995: 1,703 kg/ha → 2024: 1,872 kg/ha
+491%
Fertiliser use
1995: 3 kg/ha → 2024: 17.7 kg/ha
-21%
Rural population
1995: 79.5% → 2025: 63.1%
+68%
Water productivity
1995: 7.72 $/m3 → 2022: 13 $/m3
-11%
Health spending
2000: 3.42% → 2023: 3.05%
-23%
Forest area
1995: 561,500 km2 → 2025: 434,000 km2
+205%
Electric power use
1995: 56.3 kWh → 2024: 171 kWh
+136%
Emissions: Agriculture
1990: 32.5 MtCO2e → 2023: 76.8 MtCO2e
+179%
Emissions: Building
1990: 5.7 MtCO2e → 2023: 15.9 MtCO2e
+1421%
Emissions: Electricity/Heat
1990: 0.29 MtCO2e → 2023: 4.41 MtCO2e
+386%
Emissions: Energy
1990: 7.2 MtCO2e → 2023: 35.2 MtCO2e
+1188%
Emissions: Industrial Processes
1990: 0.25 MtCO2e → 2023: 3.22 MtCO2e
+1060%
Emissions: Manufacturing/Construction
1990: 0.4 MtCO2e → 2023: 4.64 MtCO2e
+1026%
Emissions: Transportation
1990: 0.72 MtCO2e → 2023: 8.11 MtCO2e
World Bank open data, recorded series
How much forest is left?
Forest cover moved from 63.4% to 49.6% across 29 recorded years.
World Bank, Forest area (% of land area) (AG.LND.FRST.ZS) https://data.worldbank.org/indicator/AG.LND.FRST.ZS?locations=TZ
How clean is the grid?
Renewable electricity moved from 80% to 37.2% across 26 recorded years.
World Bank, Renewable electricity output (% of total electricity output) (EG.ELC.RNEW.ZS) https://data.worldbank.org/indicator/EG.ELC.RNEW.ZS?locations=TZ
How much climate pollution per person?
CO2 per person moved from 0.097 t to 0.31 t across 29 recorded years.
World Bank, Carbon dioxide (CO2) emissions excluding LULUCF per capita (t CO2e/capita) (EN.GHG.CO2.PC.CE.AR5) https://data.worldbank.org/indicator/EN.GHG.CO2.PC.CE.AR5?locations=TZ
How many people visit?
Tourist arrivals moved from 295k to 1,527k across 24 recorded years.
World Bank, International tourism, number of arrivals (ST.INT.ARVL) https://data.worldbank.org/indicator/ST.INT.ARVL?locations=TZ
How much land is protected?
Protected land moved from 31.9% to 39.9% across 12 recorded years.
World Bank, Terrestrial protected areas (% of total land area) (ER.LND.PTLD.ZS) https://data.worldbank.org/indicator/ER.LND.PTLD.ZS?locations=TZ
How many people still farm?
Farm workforce moved from 74.1% to 64.6% across 30 recorded years.
World Bank, Employment in agriculture (% of total employment) (modeled ILO estimate) (SL.AGR.EMPL.ZS) https://data.worldbank.org/indicator/SL.AGR.EMPL.ZS?locations=TZ
How much sea is protected?
Protected sea moved from 3% to 2.3% across 12 recorded years.
World Bank, Marine protected areas (% of territorial waters) (ER.MRN.PTMR.ZS) https://data.worldbank.org/indicator/ER.MRN.PTMR.ZS?locations=TZ
How much land is farmed?
Agricultural land moved from 37.3% to 45.1% across 29 recorded years.
World Bank, Agricultural land (% of land area) (AG.LND.AGRI.ZS) https://data.worldbank.org/indicator/AG.LND.AGRI.ZS?locations=TZ
How fast is it urbanising?
Urban population moved from 20.5% to 36.9% across 30 recorded years.
World Bank, Urban population (% of total population) (SP.URB.TOTL.IN.ZS) https://data.worldbank.org/indicator/SP.URB.TOTL.IN.ZS?locations=TZ
Is the air getting cleaner?
Air pollution moved from 16.3 µg/m³ to 20.2 µg/m³ across 28 recorded years.
World Bank, PM2.5 air pollution, mean annual exposure (micrograms per cubic meter) (EN.ATM.PM25.MC.M3) https://data.worldbank.org/indicator/EN.ATM.PM25.MC.M3?locations=TZ
Is water getting scarcer?
Fresh water per person moved from 2,765 m³ to 1,298 m³ across 27 recorded years.
World Bank, Renewable internal freshwater resources per capita (cubic meters) (ER.H2O.INTR.PC) https://data.worldbank.org/indicator/ER.H2O.INTR.PC?locations=TZ
Is diet-related disease rising?
Adult overweight moved from 13.2% to 32.2% across 27 recorded years.
World Bank, Prevalence of overweight (% of adults) (SH.STA.OWAD.ZS) https://data.worldbank.org/indicator/SH.STA.OWAD.ZS?locations=TZ
Who has power?
Electricity access moved from 4.27% to 52.4% across 29 recorded years.
World Bank, Access to electricity (% of population) (EG.ELC.ACCS.ZS) https://data.worldbank.org/indicator/EG.ELC.ACCS.ZS?locations=TZ
Is income rising?
GDP per person moved from 258 to 1,319 across 30 recorded years.
World Bank, GDP per capita (current US$) (NY.GDP.PCAP.CD) https://data.worldbank.org/indicator/NY.GDP.PCAP.CD?locations=TZ
How fast is it growing?
Population moved from 30,383k to 70,546k across 30 recorded years.
World Bank, Population, total (SP.POP.TOTL) https://data.worldbank.org/indicator/SP.POP.TOTL?locations=TZ
What share of all energy is renewable?
Renewable energy use moved from 93.3% to 78.3% across 26 recorded years.
World Bank, Renewable energy consumption (% of total final energy consumption) (EG.FEC.RNEW.ZS) https://data.worldbank.org/indicator/EG.FEC.RNEW.ZS?locations=TZ
How much energy does one person use?
Energy per person moved from 363 kg to 389 kg across 29 recorded years.
World Bank, Energy use (kg of oil equivalent per capita) (EG.USE.PCAP.KG.OE) https://data.worldbank.org/indicator/EG.USE.PCAP.KG.OE?locations=TZ
How much land and sea is protected together?
Protected area, total moved from 26% to 32.3% across 12 recorded years.
World Bank, Terrestrial and marine protected areas (% of total territorial area) (ER.PTD.TOTL.ZS) https://data.worldbank.org/indicator/ER.PTD.TOTL.ZS?locations=TZ
How long do people live?
Life expectancy moved from 51 yrs to 67.2 yrs across 29 recorded years.
World Bank, Life expectancy at birth, total (years) (SP.DYN.LE00.IN) https://data.worldbank.org/indicator/SP.DYN.LE00.IN?locations=TZ
How much does a hectare of cereal produce?
Cereal yield moved from 1,703 kg/ha to 1,872 kg/ha across 29 recorded years.
World Bank, Cereal yield (kg per hectare) (AG.YLD.CREL.KG) https://data.worldbank.org/indicator/AG.YLD.CREL.KG?locations=TZ
How much fertiliser goes on the land?
Fertiliser use moved from 3 kg/ha to 17.7 kg/ha across 29 recorded years.
World Bank, Fertilizer consumption (kilograms per hectare of arable land) (AG.CON.FERT.ZS) https://data.worldbank.org/indicator/AG.CON.FERT.ZS?locations=TZ
How many people still live rurally?
Rural population moved from 79.5% to 63.1% across 30 recorded years.
World Bank, Rural population (% of total population) (SP.RUR.TOTL.ZS) https://data.worldbank.org/indicator/SP.RUR.TOTL.ZS?locations=TZ
How much value per cubic metre of water?
Water productivity moved from 7.72 $/m3 to 13 $/m3 across 27 recorded years.
World Bank, Water productivity, total (constant 2015 US$ GDP per cubic meter of total freshwater withdrawal) (ER.GDP.FWTL.M3.KD) https://data.worldbank.org/indicator/ER.GDP.FWTL.M3.KD?locations=TZ
How much goes on health?
Health spending moved from 3.42% to 3.05% across 23 recorded years.
World Bank, Current health expenditure (% of GDP) (SH.XPD.CHEX.GD.ZS) https://data.worldbank.org/indicator/SH.XPD.CHEX.GD.ZS?locations=TZ
How much forest is there in total?
Forest area moved from 561,500 km2 to 434,000 km2 across 30 recorded years.
World Bank, Forest area (sq. km) (AG.LND.FRST.K2) https://data.worldbank.org/indicator/AG.LND.FRST.K2?locations=TZ
How much electricity per person?
Electric power use moved from 56.3 kWh to 171 kWh across 29 recorded years.
World Bank, Electric power consumption (kWh per capita) (EG.USE.ELEC.KH.PC) https://data.worldbank.org/indicator/EG.USE.ELEC.KH.PC?locations=TZ
How have agriculture emissions moved?
Agriculture emissions moved from 32.52 to 76.79 MtCO2e across 33 recorded years.
Climate Watch (WRI), historical emissions
How have building emissions moved?
Building emissions moved from 5.69 to 15.87 MtCO2e across 33 recorded years.
Climate Watch (WRI), historical emissions
How have electricity/heat emissions moved?
Electricity/Heat emissions moved from 0.29 to 4.41 MtCO2e across 33 recorded years.
Climate Watch (WRI), historical emissions
How have energy emissions moved?
Energy emissions moved from 7.23 to 35.16 MtCO2e across 33 recorded years.
Climate Watch (WRI), historical emissions
How have industrial processes emissions moved?
Industrial Processes emissions moved from 0.25 to 3.22 MtCO2e across 33 recorded years.
Climate Watch (WRI), historical emissions
How have manufacturing/construction emissions moved?
Manufacturing/Construction emissions moved from 0.4 to 4.64 MtCO2e across 33 recorded years.
Climate Watch (WRI), historical emissions
How have transportation emissions moved?
Transportation emissions moved from 0.72 to 8.11 MtCO2e across 33 recorded years.
Climate Watch (WRI), historical emissions
Worst caseCurrent pathBest case
Worst case
Every measured decline continues at the pace already recorded. The weakest pillar, organic farming at 1/5, is the one that gives way first.
Computed from: recorded series extended with no policy change
Current path
Every line above is a recorded World Bank series for this country. The current path is simply those series continuing at the pace already measured.
Computed from: recorded series, no policy change assumed
Best case
The pledges are met on their own stated timetables and the weakest pillars are lifted to match the strongest. Tanzania already shows it can do this: wildlife scores 5/5.
Computed from: each published target delivered on its own date
What the best case actually asks for
Lift organic farming
It scores 1 out of 5 today, among the weakest parts of Tanzania's record. About 0.5% of agricultural land is certified organic (FiBL, 2020 data), though a large share of smallholder farming is de facto low-input and uncertified.
measured each year
Costs: spending and enforcement, not new technology
Lift recycling
It scores 1 out of 5 today, among the weakest parts of Tanzania's record. Formal municipal recycling is minimal and most waste is dumped or landfilled, but an active informal sector recovers plastics, metal and glass in cities such as Dar es Salaam.
measured each year
Costs: spending and enforcement, not new technology
Lift water
It scores 2 out of 5 today, among the weakest parts of Tanzania's record. Tanzania borders three of Africa's great lakes, Victoria, Tanganyika and Nyasa, and has major rivers such as the Rufiji and Pangani, so surface freshwater is vast.
measured each year
Costs: spending and enforcement, not new technology
Government and Goals in Tanzania.
Who is in charge of Tanzania now · Office-holders from the UN Protocol and Liaison Service public list of Heads of State and Heads of Government, 20 October 2026. Legislature and election dates from IFES ElectionGuide. Constitution dates from the Constitute Project. Governance scores from the World Bank Worldwide Governance Indicators 2024.
Samia Suluhu Hassan
President
Samia Suluhu Hassan is the head of government of Tanzania, in office since 19 March 2021. Every climate, protection and energy pledge on this page is delivered, or not, under this administration.
Public opinion, measured
Voice and accountability, the freedom to question government scores 43.3 out of 100 in 2025. On this World Bank scale, 100 is the strongest governance measured. Down from 45.0 in 2024. World Bank Worldwide Governance Indicators, 2025 data (updated 25 September 2026) https://www.worldbank.org/en/publication/worldwide-governance-indicators
Control of corruption scores 41.3 out of 100 in 2025. On this World Bank scale, 100 is the strongest governance measured. Down from 41.8 in 2024. World Bank Worldwide Governance Indicators, 2025 data (updated 25 September 2026) https://www.worldbank.org/en/publication/worldwide-governance-indicators
Political stability and absence of violence scores 57.3 out of 100 in 2025. On this World Bank scale, 100 is the strongest governance measured. Down from 59.1 in 2024. World Bank Worldwide Governance Indicators, 2025 data (updated 25 September 2026) https://www.worldbank.org/en/publication/worldwide-governance-indicators
Rule of law scores 49.2 out of 100 in 2025. On this World Bank scale, 100 is the strongest governance measured. Down from 50.0 in 2024. World Bank Worldwide Governance Indicators, 2025 data (updated 25 September 2026) https://www.worldbank.org/en/publication/worldwide-governance-indicators
Regulatory quality scores 47.0 out of 100 in 2025. On this World Bank scale, 100 is the strongest governance measured. Up from 46.5 in 2024. World Bank Worldwide Governance Indicators, 2025 data (updated 25 September 2026) https://www.worldbank.org/en/publication/worldwide-governance-indicators
Samia Suluhu HassanPresident
National Assembly (Bunge)Legislature, unicameral
Last election29 October 2025
Constitution1977, as revised to 2005
Government typepresidential republic
Tanzania national goals: what has been pledged, and how far it has got · each pledge measured against this country's own recorded delivery
2030
30% of land protected
✓ delivered
Target 3 of the Kunming-Montreal Global Biodiversity Framework, adopted by more than 190 parties in December 2022. Tanzania currently protects 39.9% of its land, which is 133% of the way to the pledge. ↗
2030
30% of sea protected
✕ far behind
The marine half of the same 30x30 pledge. Tanzania currently protects 2.3% of its territorial waters, which is 8% of the way there. ↗
2030
Paris Agreement pledge
on record
Tanzania has a Nationally Determined Contribution lodged with the UNFCCC. The registry holds the current text, its target year and the sectors it covers. ↗
Plastic policy
in force
Yes: a strict nationwide plastic-bag ban since 2019, enforced even on arriving travellers..
Grid, as it stands
37.2% renewable
Recorded renewable share of electricity output, the number every energy pledge is measured against. ↗
Plain Answers About Tanzania.
The questions people actually type, answered in full sentences from the sourced data above.
swipe →
Is Tanzania sustainable?
Tanzania scores 65 out of 100 on the Throne Eco Index, across twelve equally weighted pillars. Tanzania holds one of Earth's largest protected estates and richest wildlife, alongside low water-safety and waste infrastructure.
Is the water in Tanzania safe and plentiful?
Tanzania borders three of Africa's great lakes, Victoria, Tanganyika and Nyasa, and has major rivers such as the Rufiji and Pangani, so surface freshwater is vast. Yet only about 31% of people have safely managed drinking water (World Bank, 2024), rural and dry-region access is poor and many households rely on distant or unsafe sources.
Can Tanzania feed itself?
Agriculture employs most of the workforce and Tanzania is broadly self-sufficient in staples such as maize, cassava, bananas and rice, while exporting cashews, coffee and cotton. No verified import figure was found, and wheat, sugar and palm oil are imported, but the farm economy is dominant.
Is it easy to eat plant-based in Tanzania?
The everyday diet is built on ugali (maize), rice, beans, cassava, plantain, leafy greens (mchicha) and coconut on the coast, so unprocessed plant eating is the affordable default. It is not a formally vegetarian culture, and meat or fish are eaten when affordable.
How much of Tanzania is actually protected?
Almost 40% of Tanzania's land is protected (World Bank, 2025), among the largest protected estates on Earth, spanning the Serengeti, the Ngorongoro Conservation Area, Nyerere (Selous) and Ruaha, and these parks are actively managed and funded through tourism. Marine protection is far lower at about 2.3%, and some protected-area management has drawn criticism over community evictions.
What wildlife is left in Tanzania?
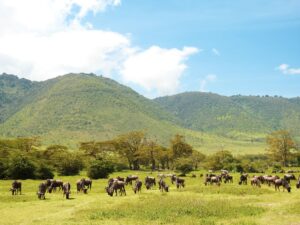
Tanzania holds arguably Africa's greatest wildlife, from the 1.5 million-strong Serengeti wildebeest migration and large elephant and lion populations to real endemism in the Eastern Arc Mountains and on Zanzibar, including the Zanzibar red colobus and the Kipunji, a monkey genus found only here.
Is Tanzania on clean energy?
Tanzania is one of the world's lowest per-capita emitters, at roughly 0.31 tonnes of CO2 per person, reflecting low industrialisation and limited electricity access. Its grid has shifted decisively towards hydropower since the 2,115 MW Julius Nyerere plant began generating, so that hydro now provides the majority of installed capacity, about 59% at the end of 2024, with natural gas the main second source at around 35%. The government's National Energy Compact and Nationally Determined Contribution aim to expand renewables and grid access, and hydro's share of generation has risen further through 2025.
How polluted is Tanzania?
Tanzania enforces a strict ban on plastic carrier bags across Mainland Tanzania, introduced on 1 June 2019 and now made under the Environmental Management (Prohibition of Plastic Carrier Bags and Plastic Bottle Cap Seals) Regulations, 2022, and checked even on arriving travellers. Air quality is moderate at about 18 micrograms of fine particles per cubic metre (AQLI, 2022), driven by biomass cooking and dust, and other waste litter persists.
Does recycling work in Tanzania?
Formal municipal recycling is minimal and most waste is dumped or landfilled, but an active informal sector recovers plastics, metal and glass in cities such as Dar es Salaam.
Is the farming in Tanzania organic?
About 0.5% of agricultural land is certified organic (FiBL, 2020 data), though a large share of smallholder farming is de facto low-input and uncertified.
Are there natural materials and craft in Tanzania?
Tanzania was historically the world's largest sisal producer and still grows sisal and cotton, while kanga and kitenge cloth are worn daily and Tanzania was historically the world's largest sisal producer and still grows sisal and cotton, while kanga and kitenge cloth remain part of everyday dress..
Is there living culture in Tanzania?
More than 120 ethnic groups keep living cultures, from the Maasai and the hunter-gatherer Hadzabe to the Chagga and the Swahili coast, and community tourism and Wildlife Management Areas channel some income locally. Much safari revenue still leaks to foreign operators, and protected-area evictions have hurt communities such as the Maasai.
What heritage does Tanzania keep alive?
Tanzania holds one of Africa's richest living heritages, spread across more than 120 ethnic groups. Ngoma drumming and dance underpin community life, the Maasai perform the adumu jumping dance, and the Swahili coast and Zanzibar sustain taarab, a fusion of African, Arab and Indian music. Ancestral and spiritual traditions remain strong, from Maasai and Sukuma ceremony to Swahili Islamic practice, and the country is home to some of the last hunter-gatherer peoples, the Hadzabe with their click language and the Datoga, alongside the Maasai and Iraqw.
So is Tanzania actually green? The measured answer
What is working: land protected at 39.9%.
What is not: sea protected at 2.3% against a 30% mark, renewable electricity at 37.2% against a 100% mark.
Tanzania sits 37 of 77 at 65/100. Every name links to its own destination page, built exactly like this one. The full ranking →
What is Tanzania particularly good at?
✓Wildlife, scored 5/5. Tanzania holds arguably Africa's greatest wildlife, from the 1.5 million-strong Serengeti wildebeest migration and large elephant and lion populations to real endemism in the Eastern Arc Mountains and on Zanzibar, including the Zanzibar red colobus and the Kipunji, a monkey genus found only here.
✓Heritage, scored 5/5. Tanzania holds one of Africa's richest living heritages, spread across more than 120 ethnic groups. Ngoma drumming and dance underpin community life, the Maasai perform the adumu jumping dance, and the Swahili coast and Zanzibar sustain taarab, a fusion of African, Arab and Indian music. Ancestral and spiritual traditions remain strong, from Maasai and Sukuma ceremony to Swahili Islamic practice, and the country is home to some of the last hunter-gatherer peoples, the Hadzabe with their click language and the Datoga, alongside the Maasai and Iraqw. This breadth of living dance, music, ancestral belief and indigenous practice marks a deep, widely alive heritage.
✓Food and farming, scored 4/5. Agriculture employs most of the workforce and Tanzania is broadly self-sufficient in staples such as maize, cassava, bananas and rice, while exporting cashews, coffee and cotton. No verified import figure was found, and wheat, sugar and palm oil are imported, but the farm economy is dominant.
Where does Tanzania score worst?
✕Organic farming, scored 1/5. About 0.5% of agricultural land is certified organic (FiBL, 2020 data), though a large share of smallholder farming is de facto low-input and uncertified.
✕Recycling, scored 1/5. Formal municipal recycling is minimal and most waste is dumped or landfilled, but an active informal sector recovers plastics, metal and glass in cities such as Dar es Salaam.
✕Water, scored 2/5. Tanzania borders three of Africa's great lakes, Victoria, Tanganyika and Nyasa, and has major rivers such as the Rufiji and Pangani, so surface freshwater is vast. Yet only about 31% of people have safely managed drinking water (World Bank, 2024), rural and dry-region access is poor and many households rely on distant or unsafe sources.
Similar countries doing it better and worse
EthiopiaScored on the same twelve pillars as Tanzania.70
UgandaScored on the same twelve pillars as Tanzania.65
KenyaScored on the same twelve pillars as Tanzania.63
EgyptScored on the same twelve pillars as Tanzania.57
BotswanaScored on the same twelve pillars as Tanzania.53
SeychellesScored on the same twelve pillars as Tanzania.53
A note from the lens of mother natureswipe →
Organic farming, 1/5
About 0.5% of agricultural land is certified organic (FiBL, 2020 data), though a large share of smallholder farming is de facto low-input and uncertified.
Consequence: It is the lowest-scoring part of Tanzania's record, so it is where the score moves first.
Recycling, 1/5
Formal municipal recycling is minimal and most waste is dumped or landfilled, but an active informal sector recovers plastics, metal and glass in cities such as Dar es Salaam.
Water, 2/5
Tanzania borders three of Africa's great lakes, Victoria, Tanganyika and Nyasa, and has major rivers such as the Rufiji and Pangani, so surface freshwater is vast.
The Tanzania Directory.
Everything on My Ideal World that sits in Tanzania, checked and listed.
How the rest of the world scores Tanzania
Independent global indices, for calibration.
Forest cover
49.6
World Bank, 2024.
Protected land
39.9
World Bank, 2025.
Protected sea
2.3
World Bank, 2025.
Renewable grid
37.2
World Bank, 2021.
CO2 per person
0.31
World Bank, 2024.
Threatened species
1320 (mammals, birds, fish & plants)
Recorded figure, sourced on this page.
Control of corruption
41.3 / 100
World Bank Worldwide Governance Indicators, 2025. Score from 0 to 100, where 100 is the strongest governance.
Government effectiveness
47.1 / 100
World Bank Worldwide Governance Indicators, 2025. Score from 0 to 100, where 100 is the strongest governance.
Rule of law
49.2 / 100
World Bank Worldwide Governance Indicators, 2025. Score from 0 to 100, where 100 is the strongest governance.
Political stability
57.3 / 100
World Bank Worldwide Governance Indicators, 2025. Score from 0 to 100, where 100 is the strongest governance.
Voice and accountability
43.3 / 100
World Bank Worldwide Governance Indicators, 2025. Score from 0 to 100, where 100 is the strongest governance.
Environmental Performance Index
38.9 / 100 · 103 of 177
Yale Environmental Performance Index 2026, ranked 103 of 177 countries assessed.
Ecosystem vitality
55.7 / 100 · 26 of 177
Yale Environmental Performance Index 2026, ranked 26 of 177 countries assessed.
Biodiversity and habitat
64.9 / 100 · 15 of 177
Yale Environmental Performance Index 2026, ranked 15 of 177 countries assessed.
Air quality
35.5 / 100 · 94 of 177
Yale Environmental Performance Index 2026, ranked 94 of 177 countries assessed.
Terrestrial biomes protected
98.1 / 100 · 18 of 177
Yale Environmental Performance Index 2026, ranked 18 of 177 countries assessed.
Marine habitat protected
37.6 / 100 · 34 of 111
Yale Environmental Performance Index 2026, ranked 34 of 111 countries assessed.
Where the numbers come from.
The institutions above are the ones cited on this page, ranked by how many of its figures they carry. This same sectioned page renders for all 77 scored destinations, each with its own researched history, comparison charts and three-way future. Read the full methodology
Every figure on this page, and where it came from: 92 sources across 28 institutions
GBIF occurrence search20 FIGURES
class Mammalia (taxonKey 359), country TZ, IUCN Red List category CR, Critically Endangered on the IUCN Red List, and recorded in Tanzania in GBIF occurrence data (mammal). check
class Mammalia (taxonKey 359), country TZ, IUCN Red List category CR corroboration check
class Mammalia (taxonKey 359), country TZ, IUCN Red List category CR corroboration check
class Mammalia (taxonKey 359), country TZ, IUCN Red List category CR corroboration check
class Mammalia (taxonKey 359), country TZ, IUCN Red List category CR corroboration check
class Aves (taxonKey 212), country TZ, IUCN Red List category CR, Critically Endangered on the IUCN Red List, and recorded in Tanzania in GBIF occurrence data (bird). check
class Aves (taxonKey 212), country TZ, IUCN Red List category CR corroboration check
class Aves (taxonKey 212), country TZ, IUCN Red List category CR corroboration check
class Testudines (taxonKey 11418114), country TZ, IUCN Red List category CR, Critically Endangered on the IUCN Red List, and recorded in Tanzania in GBIF occurrence data (turtle). check
class Testudines (taxonKey 11418114), country TZ, IUCN Red List category CR corroboration check
class Testudines (taxonKey 11418114), country TZ, IUCN Red List category CR corroboration check
class Squamata (taxonKey 11592253), country TZ, IUCN Red List category CR, Critically Endangered on the IUCN Red List, and recorded in Tanzania in GBIF occurrence data (reptile). check
class Squamata (taxonKey 11592253), country TZ, IUCN Red List category CR corroboration check
class Squamata (taxonKey 11592253), country TZ, IUCN Red List category CR corroboration check
class Amphibia (taxonKey 131), country TZ, IUCN Red List category CR, Critically Endangered on the IUCN Red List, and recorded in Tanzania in GBIF occurrence data (amphibian). check
class Amphibia (taxonKey 131), country TZ, IUCN Red List category CR corroboration check
class Amphibia (taxonKey 131), country TZ, IUCN Red List category CR corroboration check
kingdom Plantae (taxonKey 6), country TZ, IUCN Red List category CR, Critically Endangered on the IUCN Red List, and recorded in Tanzania in GBIF occurrence data (plant). check
kingdom Plantae (taxonKey 6), country TZ, IUCN Red List category CR corroboration check
kingdom Plantae (taxonKey 6), country TZ, IUCN Red List category CR corroboration check
World Bank18 FIGURES
Forest area (% of land area) AG.LND.FRST.ZS, 2023 check
Terrestrial protected areas (% of land) ER.LND.PTLD.ZS, 2025 check
Marine protected areas (% of territorial waters) ER.MRN.PTMR.ZS, 2025 check
Renewable electricity output (% of total) EG.ELC.RNEW.ZS, 2021 check
People using safely managed drinking water (% of population) SH.H2O.SMDW.ZS, 2024 check
Threatened species (mammals EN.MAM.THRD.NO, birds EN.BIR.THRD.NO, fish EN.FSH.THRD.NO, higher plants EN.HPT.THRD.NO), 2022 check
CO2 emissions per capita EN.GHG.CO2.PC.CE.AR5, 2024 check
indicator ER.LND.PTLD.ZS, Terrestrial protected areas (% of total land area), United Republic of Tanzania, Almost 40% of Tanzania's land is protected (World Bank, 2025), among the largest protected estates on Earth, s check
indicator ER.LND.PTLD.ZS, Terrestrial protected areas (% of total land area), United Republic of Tanzania corroboration check
indicator ER.LND.PTLD.ZS, Terrestrial protected areas (% of total land area), United Republic of Tanzania corroboration check
indicator ER.LND.PTLD.ZS, Terrestrial protected areas (% of total land area), United Republic of Tanzania corroboration check
indicator ER.LND.PTLD.ZS, Terrestrial protected areas (% of total land area), United Republic of Tanzania corroboration check
indicator ER.LND.PTLD.ZS, Terrestrial protected areas (% of total land area), United Republic of Tanzania corroboration check
indicator ER.LND.PTLD.ZS, Terrestrial protected areas (% of total land area), United Republic of Tanzania corroboration check
indicator ER.LND.PTLD.ZS, Terrestrial protected areas (% of total land area), United Republic of Tanzania corroboration check
indicator EN.GHG.CO2.PC.CE.AR5, CO2 emissions excluding LULUCF per capita, compiled from EDGAR (Joint Research Centre, European Commission), Tanzania is one of the world's lowest per-capita emitters, at roughly 0.31 tonnes of CO2 per person, reflectin check
indicator EN.GHG.CO2.PC.CE.AR5, CO2 emissions excluding LULUCF per capita, compiled from EDGAR (Joint Research Centre, European Commission) corroboration check
indicator EN.GHG.CO2.PC.CE.AR5, CO2 emissions excluding LULUCF per capita, compiled from EDGAR (Joint Research Centre, European Commission) corroboration check
FAO4 FIGURES
FAOSTAT, Production: Crops and livestock products (QCL), full normalised bulk dataset, updated 23 December 2025, Tanzania was historically the world's largest sisal producer and still grows sisal and cotton, while kanga and check
FAOSTAT, Production: Crops and livestock products (QCL), full normalised bulk dataset, updated 23 December 2025 corroboration check
FAOSTAT, Production: Crops and livestock products (QCL), full normalised bulk dataset, updated 23 December 2025 corroboration check
FAOSTAT, Production: Crops and livestock products (QCL), full normalised bulk dataset, updated 23 December 2025 corroboration check
Mturi4 FIGURES
Amini Aza, 'Land use planning and the conservation and management of World Heritage Sites of Kilwa Kisiwani and Songo Mnara, Tanzania', 1987, ICOMOS Open Archive (record openarchive.icomos.org/id/eprint/803), The ruins of Kilwa Kisiwani and Songo Mnara are inscribed by UNESCO. check
Amini Aza, 'Land use planning and the conservation and management of World Heritage Sites of Kilwa Kisiwani and Songo Mnara, Tanzania', 1987, ICOMOS Open Archive (record openarchive.icomos.org/id/eprint/803) corroboration check
Amini Aza, 'Land use planning and the conservation and management of World Heritage Sites of Kilwa Kisiwani and Songo Mnara, Tanzania', 1987, ICOMOS Open Archive (record openarchive.icomos.org/id/eprint/803) corroboration check
Amini Aza, 'Land use planning and the conservation and management of World Heritage Sites of Kilwa Kisiwani and Songo Mnara, Tanzania', 1987, ICOMOS Open Archive (record openarchive.icomos.org/id/eprint/803) corroboration check
UNESCO Institute for Statistics4 FIGURES
public data API, indicator XGDP.FSGOV, government expenditure on education as a percentage of GDP, Tanzania, Public spending on education runs at 3.2% of GDP and 13.4% of all government spending, and secondary enrolment check
public data API, indicator XGDP.FSGOV, government expenditure on education as a percentage of GDP, Tanzania corroboration check
public data API, indicator XGDP.FSGOV, government expenditure on education as a percentage of GDP, Tanzania corroboration check
public data API, indicator XGDP.FSGOV, government expenditure on education as a percentage of GDP, Tanzania corroboration check
BirdLife International, IUCN and UNEP-WCMC3 FIGURES
UN SDG Global Database, terrestrial Key Biodiversity Areas covered by protected areas (%) ER_PTD_TERR, Tanzania, 2025 (65.0%), country-reported check
UN SDG Global Database, marine Key Biodiversity Areas covered by protected areas (%) ER_MRN_MPA, Tanzania, 2025 (54.0%), country-reported check
UN SDG Global Database, freshwater Key Biodiversity Areas covered by protected areas (%) ER_PTD_FRHWTR, Tanzania, 2025 (43.6%), country-reported check
Other published sources3 FIGURES
The 2019 regulations (GN 394 of 2019) were revoked on 6 May 2022 and replaced by GN 291 of 2022; both apply to Mainland Tanzania only, and no credible source was found measuring the litter reduction check
The 27.7 point gap is marine only (2.3% of territorial waters, 2025); terrestrial protection is 39.9%, already above 30% check
Characteristic rather than unique; coral stone bound with lime mortar is also the traditional building system of the Red Sea coast. The tenth-century dating of the first coral buildings and coins is confirmed check
Convention on Biological Diversity2 FIGURES
country profile for the United Republic of Tanzania (drawn from Tanzania's national reports and NBSAP) corroboration check
country profile for the United Republic of Tanzania (drawn from Tanzania's national reports and NBSAP) corroboration check
FAO, Global Forest Resources Assessment2 FIGURES
UN SDG Global Database, forest area (% of land area) AG_LND_FRST, Tanzania, 2025 (49.0%), country-reported check
UN SDG Global Database, forest area inside legally established protected areas (%) AG_LND_FRSTPRCT, Tanzania, 2025 (34.5%), country-reported check
Tanzania National Parks (TANAPA)2 FIGURES
Kilimanjaro National Park, Mount Kilimanjaro, Africa's highest peak and the world's tallest free-standing mountain. check


 EthiopiaScored on the same twelve pillars as Tanzania.70
 UgandaScored on the same twelve pillars as Tanzania.65
 KenyaScored on the same twelve pillars as Tanzania.63
 EgyptScored on the same twelve pillars as Tanzania.57
 BotswanaScored on the same twelve pillars as Tanzania.53
 SeychellesScored on the same twelve pillars as Tanzania.53