Destinations › Africa · The Destination Index · universal template · every figure sourced
Zimbabwe.
Southern Africa, between South Africa and Zambia. 390,757 sq km and 16,950,795 people, landlocked, with no coastline at all, tropical; moderated by altitude; rainy season (November to March).
Region · AfricaPopulation · ~16,950,795Languages · Shona, Ndebele, English. Sixteen languages are official, including Tonga, Kalanga and sign languageEco Index · 62/100 · Passable
The Eco Index across 12 pillars · scored 0 to 5 · World Bank, OWID, WHO/UNICEF JMP, FiBL, Protected Planet, IUCN, UNESCO (2023-24)
Water
Food & farming
Plant-based
Organic
Conservation
Wildlife
Materials
Pollution
Recycling
Energy
Culture
Heritage
The History of Zimbabwe.
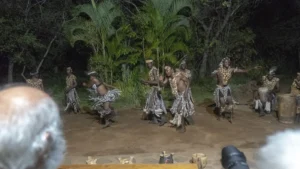
Zimbabwe holds a profound living musical and spiritual heritage centred on the mbira, the signature instrument of the Shona people. In the Bira ceremony, one of the most important in traditional Shona religion, mbira music plays through the night to call an ancestral spirit into a medium, who is then asked for advice and guidance.
Where the name comes from
Zimbabwe was adopted as the country's name at independence from the United Kingdom in 1980, and before that it had been Southern Rhodesia, according to the UK Permanent Committee on Geographical Names.
The land itself: a high plateau with a higher central spine, the high veld, and mountains along the eastern border. Its high point is Nyangani, 2,592 m. Source: UK Permanent Committee on Geographical Names toponymic factfile.
Where it starts
Painted walls, then a stone city
Granite shelters in the Matobo Hills south of Bulawayo show people living there for at least 500,000 years, and the hills hold one of the highest concentrations of rock art in southern Africa, dating back at least 13,000 years. Local communities still use shrines in the hills. Great Zimbabwe followed, a Shona stone city built between about 1100 and 1450 whose World Heritage property covers 722 hectares. Glass beads and porcelain from China and Persia found there show long-standing trade. The Shona word Zimbabwe means house in stone.
How it got here
Mutapa, Rhodesia, Zimbabwe
The Mutapa state, thought to have been linked to Great Zimbabwe, rose and declined between the 1200s and 1600s, mining gold and trading internationally. A pioneer column of European settlers arrived in 1890 under Cecil Rhodes and his British South Africa Company, and the territory was named Southern Rhodesia after him. A white minority government declared independence unilaterally in 1965, a guerrilla war against white rule followed, and Zimbabwe became independent on 18 April 1980.
The timeline
At least 500,000 years ago
Stone Age shelters.
Granite shelters in the Matobo Hills show people living there for at least 500,000 years, through the Stone Age and into the Iron Age, far deeper than the painted layers. ↗
c. 13,000 years ago onward
The Matobo Hills.
The granite hills some 35 km south of Bulawayo hold one of the highest concentrations of rock art in southern Africa, dating back at least 13,000 years. Local communities still use shrines and sacred places in the hills. ↗
11th to 15th century
Trade with the coast.
Excavations at Great Zimbabwe have found glass beads and porcelain from China and Persia, and gold and Arab coins from Kilwa, evidence of long-standing trade with the wider world. ↗
11th to 15th century
Great Zimbabwe.
A Shona city built between about 1100 and 1450, with granite walls and a population of more than 10,000 at its height. The World Heritage site covers 722 hectares, and the Shona word Zimbabwe means house in stone. ↗
1450 to 1650
Khami.
After Great Zimbabwe is abandoned, Khami, 22 km from present-day Bulawayo, becomes the capital of the Torwa dynasty. The site, a complex of dry stone walled platforms, covers about 108 hectares. ↗
1200s to 1600s
The Mutapa state.
The Monomotapa, or Mutapa, state rises and declines. It is thought to have been linked to Great Zimbabwe and was involved in gold mining and international trade. ↗
1890
British occupation.
A pioneer column of European settlers arrives at the site of the future capital, Harare, a year after Cecil Rhodes's British South Africa Company won a British mandate to colonise the territory. It is later named Southern Rhodesia after him. ↗
1965 to 1979
UDI and the liberation war.
Ian Smith's white minority government declares independence unilaterally, and a guerrilla war against white rule follows until the 1979 peace agreement. ↗
1980
Independence.
Zimbabwe becomes independent on 18 April 1980, after Robert Mugabe's party wins the independence elections. ↗
About 28% of Zimbabwe's land area is under protection (World Bank/UNEP-WCMC, 2025), a strong estate that includes Mana Pools National Park, a UNESCO World Heritage Site, along with Hwange, Gonarezhou and Matobo. The country anchors part of the Kavango-Zambezi Transfrontier Conservation Area, the largest such initiative in the world, and runs community conservancies alongside the state parks. Enforcement is stretched by underfunding and poaching, but the flagship reserves are genuinely managed rather than paper parks.
Is wild Zimbabwe protected? 28.3% of the land is, against a 30% target for 2030
Found only here. Eastern Highlands near-endemics such as Swynnerton's robin and Roberts's warbler, plus the endemic flora of the Chimanimani and Nyanga mountains.
The watchlist
ThreatenedBlack Rhino (Diceros bicornis)Critically Endangered on the IUCN Red List, and recorded in Zimbabwe in GBIF occurrence data (mammal).
ThreatenedNecrosyrtes monachusCritically Endangered on the IUCN Red List, and recorded in Zimbabwe in GBIF occurrence data (bird).
ThreatenedAfrican elephant (Loxodonta africana)Endangered on the IUCN Red List, and recorded in Zimbabwe in GBIF occurrence data (mammal).
ThreatenedGyps africanusCritically Endangered on the IUCN Red List, and recorded in Zimbabwe in GBIF occurrence data (bird).
ThreatenedTrigonoceps occipitalisCritically Endangered on the IUCN Red List, and recorded in Zimbabwe in GBIF occurrence data (bird).
ThreatenedBateleur (Terathopius ecaudatus)Endangered on the IUCN Red List, and recorded in Zimbabwe in GBIF occurrence data (bird).
ThreatenedBalearica regulorumEndangered on the IUCN Red List, and recorded in Zimbabwe in GBIF occurrence data (bird).
ThreatenedPolemaetus bellicosusEndangered on the IUCN Red List, and recorded in Zimbabwe in GBIF occurrence data (bird).
Critically Endangered, the last IUCN category before Extinct in the Wild, and still recorded in Zimbabwe. GBIF holds 6 verified occurrence records.
Necrosyrtes monachus
Critically Endangered, the last IUCN category before Extinct in the Wild, and still recorded in Zimbabwe. GBIF holds 288 verified occurrence records.
Gyps africanus
Critically Endangered, the last IUCN category before Extinct in the Wild, and still recorded in Zimbabwe. GBIF holds 238 verified occurrence records.
Trigonoceps occipitalis
Critically Endangered, the last IUCN category before Extinct in the Wild, and still recorded in Zimbabwe. GBIF holds 35 verified occurrence records.
Species named here are drawn from GBIF occurrence records for Zimbabwe filtered to the IUCN Red List threatened categories. Species are listed where GBIF holds occurrence records for them in this country. Record counts are not published here because the figure cannot be reproduced from a public GBIF query.
National park in Matabeleland North Province, mapped and named in the open record for Zimbabwe. OpenStreetMap.
Water and Ocean in Zimbabwe.
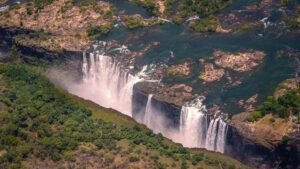
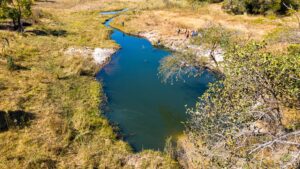
Zimbabwe sits on real freshwater assets: the Zambezi forms its northern border and feeds Lake Kariba, the largest reservoir in the world by volume, while the Limpopo, Save and Manyame rivers and a network of dams serve the interior. Despite this, only about 25% of the population has safely managed drinking water (WHO/UNICEF JMP, 2024), and recurrent droughts, including the severe 2024 El Nino drought that was declared a national disaster, expose the drier south. Urban supply is fragile, with Harare's overstretched treatment works and periodic cholera and typhoid outbreaks a recurring problem.
Does Zimbabwe have enough fresh water? Under pressure
25.5% of people here have safely managed drinking water at home (2024, WHO/UNICEF JMP). Coverage is well short of universal, so a visitor should not assume the tap is safe.
Cleanest water: The mountain streams of the Eastern Highlands (Nyanga and Chimanimani).
How much fresh water does Zimbabwe have, per person?
763 m³
Zimbabwe
1,000 m³
the UN “water scarce” line
Zimbabwe withdraws about 4,910 million cubic metres of fresh water a year (2022). That is 46.1% of the fresh water actually available to it, which FAO counts as high water stress. Of what is taken, farming takes 87%, homes and towns 11%, industry 2%. Source: FAO AQUASTAT.
Where does the sewage go?
23.6%
of people have safely managed sanitation
23.6% of people here use a safely managed sanitation service, meaning waste is contained, emptied and treated rather than reaching the ground or the sea untreated (2024, World Bank / WHO-UNICEF JMP, SDG 6.2.1). The rest is what the rivers and the coast receive.
Is the tap water safe in Zimbabwe?
25.5% of people have safely managed drinking water at home (2024, WHO/UNICEF JMP). Renewable fresh water works out at about 763 cubic metres per person a year (World Bank).
How hard is the water supply being pushed?
Of every 10 buckets nature refills, 5 are already taken. Withdrawals run at 46.1% of what Zimbabwe renews internally each year (2022, World Bank / FAO AQUASTAT). That is past the 25% mark generally treated as water stress, so the supply is being pushed towards its limit.
When is the best time to visit Zimbabwe? Tap your month.
Tap your month.
JanFebMarAprMayJunJulAugSepOctNovDec
.
How much fresh water does Zimbabwe actually have?
Nature renews about 763 cubic metres of fresh water per person per year here. That ranks Zimbabwe 44 of 208 countries measured, putting it in the drier half of the world. The UN treats anything under 1,000 cubic metres as water scarce, and this is below that line. World Bank / FAO AQUASTAT.
Maize is the main cereal, grown alongside sorghum and millet. Food imports ran at roughly 19% of merchandise imports in 2024 (World Bank). That balance is fragile. After the 2024 drought Zimbabwe imported 1.5 million tonnes of maize in 2024/25, and 57% of the rural population was expected to need food assistance in the early 2025 lean season. The 2025 maize harvest of 1.82 million tonnes was nearly triple the drought year (FAO GIEWS).
Where does the food in Zimbabwe come from?
19.0% imported
about US$1,917m a year
On the plate: Sadza (maize meal), muriwo leafy greens (covo, rape, pumpkin leaves), groundnuts, beans, sweet potato, and small grains such as millet and sorghum.
How often each food is on the plate
Share of people eating each one regularly. These overlap, so they do not add up to 100%.
Maize22%
Wheat10%
2 of 10
bites are imported
Zimbabwe buys in more food energy than it eats. About US$1,917m a year leaves the country to pay for it. The green slice is roughly what still grows here.
About 19% of everything Zimbabwe buys in from abroad is food, roughly 2 in every 10 imported items on the dock (2024, World Bank). Farming itself is 9.5% of the economy and 41.8% of the land is agricultural, of which 10.4% is arable. The green slice is roughly what still grows here.
What is killing people in Zimbabwe? The imported diet.
Cause of death, and the diet behind it.
Non-communicable diseases, all combined38.3%
Diabetes1.5%
There is no national count. In a 2024 study of 352 people with diabetes at 16 primary care clinics in Harare, 3 per cent had already lost part of a limb to amputation and 17 per cent had foot ulcers, and more than half showed signs of diabetic foot disease. Source: BMC Public Health, 2024.
Adults living with overweight or obesity. 34.5%.
Can Zimbabwe feed itself?
10.4%
Arable land
48.1%
Agricultural land
3,722,889
Farmers
9,934,628
Arable acres
9.5%
Agriculture, share of GDP
Harvest: Main maize and tobacco harvest from April to July, following the November to March rains; the tobacco auction season opens around March.
Feeding itself
Agriculture underpins the economy and employs a large share of the rural population, producing maize, tobacco (a leading export), cotton, sugar, groundnuts and cattle. Food imports run at roughly 19% of merchandise imports (World Bank, 2024), reflecting a country that is normally close to self-sufficient in its staple maize.
Certification
Certified organic farming is negligible, at about 0.01% of agricultural land, roughly 1,043 hectares (FiBL, 2020). Much smallholder farming is low-input by necessity rather than by certification, and bodies such as the Zimbabwe Organic Producers and Promoters Association work to build the sector, but formal certified organic area remains tiny.
Water for crops
Zimbabwe sits on real freshwater assets: the Zambezi forms its northern border and feeds Lake Kariba, the largest reservoir in the world by volume, while the Limpopo, Save and Manyame rivers and a network of dams serve the interior. Despite this, only about 25% of the population has safely managed drinking water (WHO/UNICEF JMP, 2024), and recurrent droughts, including the severe 2024 El Nino drought that was declared a national disaster, expose the drier south.
Why the organic number looks like that. Certification covers only part of what is grown cleanly, so a small certified share is a gap in the paperwork rather than proof that nothing is. What the official land record does show: 41.8% of the country is agricultural land and 10.4% is arable (2023, World Bank). Certification is paid for per farm per year by a foreign body, which prices out smallholders, so the organic number reads worse than the practice.
The plant-based kitchen here is not an import. By tonnage, the largest crops grown in Zimbabwe are sugarcane, potatoes, maize, cabbages and wheat (FAO, FAOSTAT crop production, 2024). That is what the land itself puts on a plate.
Buy direct where residents buy: Angels Mini Market, Bon Marche, Esigodini Vegetable Market, Gwanda Traders Market, Mganwini Flea Market, Africa flea market. Each is a mapped, named marketplace, so the money stays with the seller rather than the importer. OpenStreetMap.
Not yet checked by us. Plant based kitchens listed publicly: Vegan Vibes, all vegan shop in Harare: cashew cheese, nut milks, plant protein and fresh baked sweet and savoury goods; Queen Makeda, Ethiopian restaurant in Harare: vegetable stew, lentil curry and chickpea flour in berbere sauce; Yanaya, restaurant in Sam Levy's Village, Harare: labelled vegan burger, wrap, falafel bowl and smoothies; Cafe Veldemeers, restaurant in Harare: vegan pizza, pasta, wraps and salads; Kow Lee Foods, Chinese takeaway in Avondale, Harare: tofu and vegetable dishes, and tofu sold by the block. Tell us how they are.
Is this grown in Zimbabwe?
Tap a food for the honest answer.
RapeGroundnutsBeansSweet potatoSmall grains such as millet
.
RapeGroundnutsBeansSweet potatoSmall grains such as millet
Zimbabwe's grid leans on two large stations, the Kariba hydropower dam and the Hwange coal plant, with hydropower supplying about 53 per cent of generation in 2023, coal around 26 per cent and imports much of the rest. Coal dominates installed capacity at roughly 57 per cent, and the country is expanding the Hwange coal units, which weighs against its clean profile. Even so, emissions per person are very low at around 0.8 tonnes of CO2 a year (World Bank, 2024). Zimbabwe's revised NDC targets a conditional 40 per cent cut in per capita emissions across the economy by 2030 against a 2017 baseline, supported by the National Climate Policy. It is a low emitter with a majority renewable grid, though coal dependence and conditional delivery temper the picture.
What powers Zimbabwe?
Renewable 57.1%Fossil 42.9%
ZESA Holdings is wholly owned by the government. Its subsidiary, the Zimbabwe Electricity Transmission and Distribution Company (ZETDC), owns and runs the transmission and distribution grid, while the Zimbabwe Power Company (ZPC) owns the state power stations. The Zimbabwe Energy Regulatory Authority (ZERA), set up in 2011, licenses and regulates the sector. The state's Mutapa Investment Fund took control of ZESA in 2020. In October 2026 the Sunday Mail reported that ZESA Holdings, ZPC and ZETDC are being merged into one company, ZESA Private Ltd, as Ernst and Young had recommended in 2019. ZESA owes about US$1.79 billion in foreign debt.
Climate pollution per person
The safe amount, what the planet can absorb
2 tonnes
One person here
0.77 tonnes
The world average, for comparison
4.7 tonnes
The worst it ever got
1.85 tonnes
The grid
Zimbabwe's grid leans on two large stations, the Kariba hydropower dam and the Hwange coal plant, with hydropower supplying about 53 per cent of generation in 2023, coal around 26 per cent and imports much of the rest. Coal dominates installed capacity at roughly 57 per cent, and the country is expanding the Hwange coal units, which weighs against its clean profile.
Pollution
Zimbabwe prohibits expanded polystyrene (kaylite) food containers under Statutory Instrument 84 of 2012, a ban the Environmental Management Agency publicised and began enforcing in July 2017, and sets a minimum plastic packaging thickness of thirty micrometres under Statutory Instrument 98 of 2010, but enforcement is patchy and urban litter and illegal dumping are common. Ambient air is moderately polluted, with fine particulate matter (PM2.5) averaging around 22 micrograms per cubic metre, above the WHO guideline, driven by vehicle emissions, waste burning, and mining and industry.
Water stress
Zimbabwe sits on real freshwater assets: the Zambezi forms its northern border and feeds Lake Kariba, the largest reservoir in the world by volume, while the Limpopo, Save and Manyame rivers and a network of dams serve the interior. Despite this, only about 25% of the population has safely managed drinking water (WHO/UNICEF JMP, 2024), and recurrent droughts, including the severe 2024 El Nino drought that was declared a national disaster, expose the drier south.
What pollutes most here
1The gridThe share of electricity still generated from fossil fuel.47%
2IndustryMercury-using artisanal gold mining and coal mining and power generation at Hwange are the main polluters..named
3AirModelled annual mean against a WHO guideline of 5 µg/m³.22
4On the recordZimbabwe prohibits expanded polystyrene (kaylite) food containers under Statutory Instrument 84 of 2012, a ban the Environmental Management Agency publicised and began enforcing in July 2017, and sets a minimum plastic packaging thickness of thirty micrometres under Statutory Instrument 98 of 2010, but enforcement is patchy and urban litter and illegal dumping are common.
What has Zimbabwe promised on climate?
Electricity renewable today88.3% (2021)
Land protected, against a 30% target28.3% by 2025
Measured on delivery, 88.3% of electricity is already renewable (2021, World Bank), so 11.7% of the grid is still to be converted. The pledge on file is measured here against what has actually been delivered, not taken on its own (UNFCCC NDC Registry, CBD Kunming-Montreal Target 3).
The biggest line item
One return flight against a whole year of living.
A resident's entire year0.77 t CO2e
Safe-climate budget, per year2 t CO2e
Los Angeles return, economy2.97 t CO2e
New York return, economy2.26 t CO2e
Sydney return, economy2.06 t CO2e
London return, economy1.49 t CO2e
Singapore return, economy1.49 t CO2e
How much CO2 does flying to Zimbabwe emit?
Tap where you would fly from. One return flight, economy.
Los AngelesNew YorkSydneyLondonSingapore
.
Firsts on climate finance. In July 2024 the African Risk Capacity Group, an African Union agency, paid out about US$31.8 million after Zimbabwe's drought insurance was triggered by the El Niño drought. The government received US$16.8 million, the World Food Programme US$6.1 million and the Start Network US$8.9 million. The finance minister said the money would help 509,000 households in 27 districts. The Green Climate Fund lists four projects in Zimbabwe worth US$72.4 million in total, including a UNDP project to build the climate resilience of farmers in southern Zimbabwe.
Every prompt runs on a machine in a building on somebody’s grid. What that costs the planet depends less on the prompt than on what is burning to power it. Here is what would power one in Zimbabwe.
Data centres
1
Registered colocation and interconnection facilities, PeeringDB, 2026
Grid renewable
57.1 %
What a machine here runs on.
What powers a data centre in Zimbabwe?
A machine here runs mostly on renewables, but not entirely.
Renewable 57.1%Fossil 42.9%
Cooling water. Every one of those halls runs on the national grid, which is 88.3% renewable today (World Bank). A data centre is only as clean as the electricity behind it, so the same figure that decides this country's climate score also decides the footprint of the AI running inside it. Cooling water use is not separately published by facility, and no operator here reports it.
The rules. Zimbabwe has 1 colocation and interconnection facilities on the public PeeringDB register, concentrated in Harare (1), alongside 1 internet exchange (Harare IX). Named sites include Utande Internet Services.
88% residents to 12% visitors across a year. 2,294,000 international arrivals in 2019 against 16,950,795 people who live here (2025, World Bank / UN Tourism).
Where a visitor dollar goes in Zimbabwe
639k
Visitors a year
0.0
Visitors per resident
How deep in debt is Zimbabwe?· for every $100 Zimbabwe earns in a year, it owes…
Pay to the order of: the creditorsmemo · the 2023 peak
$ 76The worst year on the IMF record. Zimbabwe owed $76 for every $100 it earned.
IMF World Economic Outlook, 2023signed, the creditors
Pay to the order of: the creditorsmemo · today
$ 42What is owed now, for every $100 of national income (2026).
IMF World Economic Outlook, 2026signed, the creditors
Pay to the order of: the creditorsmemo · projected 2031
$ 38The IMF's own forecast has this falling to $38 by 2031.
IMF World Economic Outlook projection, 2031signed, the forecast
For every $100 Zimbabwe earns in a year, it owes $42 (2026, IMF World Economic Outlook). The interest on that is paid before schools, clinics or coastline get their turn.
Where does a tourist dollar actually go in Zimbabwe?
Play one tourist dollar around the board. Every square is a measured fact from this page.
START!
1
GO: a visitor lands
$100 goes on the table. 2,294,000 international arrivals in 2019 against 16,950,795 residents, one visitor a year for every 7 residents (World Bank / UN Tourism).
$100 in play
2
The bed
Who owns the largest places to stay in Zimbabwe is not published in the records we can check, so this square is left open rather than guessed. Where a listing names its owner, it is shown in the ownership table below.
not published
3
The plate
Food is 19% of everything Zimbabwe imports (2024, World Bank), so a large part of every restaurant bill is paid to a supplier abroad. Eating what the land here actually grows, sugarcane, maize, cabbages, potatoes, tomatoes, onions, bananas, wheat, keeps that money with the grower.
sails in
4
The power
88.3% of the electricity is renewable (2021, World Bank), so the energy on the bill is mostly generated inside the country rather than shipped in.
made at home
5
What actually stays
On the parts that can be measured, the plate leaves and the power stays. It is genuinely a coin toss, decided by what you book.
split
6
Pay the bank first
Zimbabwe owes $42 for every $100 it earns (IMF World Economic Outlook, 2026 projection). The interest is paid before anything else on this board.
$42 per $100
7
No plan B
31.2% of everything Zimbabwe sells abroad is pearls, gemstones and precious metals (2023, UN Comtrade). One market moving takes the whole board with it.
31.2% one export
8
Community chest
Tourism earns 1.3% of everything Zimbabwe makes from exports (2020, World Bank / UN Tourism). That is how much of the economy depends on the game continuing.
1.3% of exports
9
The flight
Getting here is usually the biggest single line on the bill. From Los Angeles a return economy seat is 2.97 t CO2, on the UK Government's published conversion factors. It is the one part of the trip this board cannot reduce.
2.97 t CO2
10
Back to GO
The economy turns over about US$57 billion a year (IMF World Economic Outlook, 2026 projection). Every lap of this board is a choice about how much of it stays.
US$57bn
GDPUS$51.2bn
Agriculture, share of GDP9.5%
Visitors a year639,000
Visitors per resident0
Residents~16,950,795
Agriculture
Farming is 9.5% of the economy. Agriculture underpins the economy and employs a large share of the rural population, producing maize, tobacco (a leading export), cotton, sugar, groundnuts and cattle.
Natural materials
Cotton has long been a major smallholder crop, once nicknamed the country's white gold, and is still spun and woven locally. The Tonga and Binga communities of the Zambezi valley are known for tightly coiled baskets made from ilala palm and natural dyes, a living craft sold across the region, alongside sisal cordage, reed mats and traditional weaving.
Energy
Zimbabwe's grid leans on two large stations, the Kariba hydropower dam and the Hwange coal plant, with hydropower supplying about 53 per cent of generation in 2023, coal around 26 per cent and imports much of the rest. Coal dominates installed capacity at roughly 57 per cent, and the country is expanding the Hwange coal units, which weighs against its clean profile.
Who owns the biggest hotels in Zimbabwe?
By rooms · company records and press.
Gorges Lodge Zimbabwe · ~30 roomsFamily Businessnot published
Visitors, over time
20152,057k
20162,168k
20172,423k
20182,580k
20192,294k
2020639k
International tourism receipts run at about US$0.07 billion in 2020 (World Bank / UN Tourism). That is 1.3% of everything the country earns from exports.
How much of your money actually stays here?
Tap the holiday you are planning.
All-inclusive resortForeign-owned hotel and tourist restaurantsLocally owned stay and local restaurantsGuesthouse, markets and public transport
Resort guest, villa renter, family, nomad or backpacker. The honest playbook for each, from the same sourced numbers.
Already booked a resort? · the rescue list
Practical swaps that keep more of your money in the local economy
1. Eat where the country eats Choose kitchens cooking sadza (maize meal), muriwo leafy greens (covo, rape, pumpkin leaves), groundnuts, beans, sweet potato, and small grains such as millet and sorghum. over imported menus.
2. Book with a local operator Never the lobby desk. The margin on a tour is the part that stays.
3. Stay somewhere locally owned Ownership decides where the room rate books. Eco stays →
4. Use the transport residents use Intercity coaches and shared kombis link the towns, domestic flights connect Harare, Bulawayo and Victoria Falls, and self-drive or a hired guide is best for the national parks.
5. Buy the craft, not the souvenir Natural-materials work made here pays the maker directly; imported gifts pay a shipping line.
swipe →
First time here
A landlocked southern-African country of vast miombo woodlands, one of the continent's largest elephant populations and the pioneering CAMPFIRE model of community-run wildlife conservation.
Best time: The cool, dry season, when wildlife concentrates at water and the bush is thinner for viewing.
Getting around
Intercity coaches and shared kombis link the towns, domestic flights connect Harare, Bulawayo and Victoria Falls, and self-drive or a hired guide is best for the national parks.
Transport is where the fare either stays or leaves.
Eating here
The everyday plate is sadza (maize meal), muriwo leafy greens (covo, rape, pumpkin leaves), groundnuts, beans, sweet potato, and small grains such as millet and sorghum.. The everyday diet is built on sadza, a stiff porridge of maize meal and increasingly of small grains like millet and sorghum, eaten with muriwo, leafy greens such as covo and rape, plus groundnut relish (dovi), beans, pumpkins and sweet potatoes.
Eating what the country grows is the cheapest way to cut the import bill.
Good to know
USD is the working currency; small notes are essential. Cards at big lodges.
Rate my hotel. Tap yours for the honest verdict.
Ownership from company records and press.
Gorges Lodge Zimbabwe
.
Who owns the place to stay
Gorges Lodge ZimbabweFamily Business · 30 rooms
The one property listed here does not publish who ultimately owns it, so no claim is made either way. Ownership is what decides how much of a room rate stays in the country, which is why we show it when a listing states it.
Society and Governance in Zimbabwe.
How well is Zimbabwe actually run?
Governance, measured · World Bank WGI
Four measured answers, none of them opinion. Averaged across corruption control, delivery and accountability, Zimbabwe scores 30 out of 100 (2024, World Bank Worldwide Governance Indicators). That matters here because every pledge on this page is only as good as the machinery meant to deliver it.
How well is Zimbabwe run? · each scored out of 100, higher is better
Clean government, scored 22 of 100
Control of corruption scores 22.0 out of 100 (2025, World Bank Worldwide Governance Indicators). That is in the bottom quarter of governments measured.
22
Freedom and rights, scored 34 of 100
Voice and accountability, which measures free expression, free media and the ability to choose a government, scores 33.9 out of 100 (2025, World Bank WGI). Room to question the government publicly is limited.
34
Government effectiveness, scored 34 of 100
Government effectiveness, which measures the quality of public services and how well policy is actually delivered, scores 34.2 out of 100 (2025, World Bank WGI). Delivery is rated below average, so a pledge on paper is not the same as a pledge kept.
34
Income equality, scored 50 of 100
The Gini index of income inequality reads 50.3 (2019, World Bank). Zero is perfect equality and 100 is one person holding everything. Above 40 is the level usually treated as socially strained, and Zimbabwe sits above it.
50
LGBTQ+ status: IllegalSolo female travel: Take care93.2% adult literacyIndustry to avoid: Mercury-using artisanal gold mining and coal mining and power generation at Hwange are the main polluters.
What is daily life in Zimbabwe really like? Measured
Getting around, breathing, throwing away, learning. The honest checklist.
TransportAirWaterWastePower
✓How you get around Intercity coaches and shared kombis link the towns, domestic flights connect Harare, Bulawayo and Victoria Falls, and self-drive or a hired guide is best for the national parks.
✓Air quality, measured Modelled annual mean 22. The WHO guideline is 5 µg/m³.
✓Where the air is cleanest The cool, forested Eastern Highlands around Nyanga, Vumba and Chimanimani.
·Tap water Not drinkable
✓What to drink Bottled water; Victoria Falls town supply is unreliable, stock up.
✓Plastic rules Expanded polystyrene (kaylite) food containers prohibited under Statutory Instrument 84 of 2012, enforced from July 2017; plastic packaging must be at least thirty micrometres thick under Statutory Instrument 98 of 2010.
✓Sockets and voltage Type C/D/M, 230V
93.2%
literacy. Public spending on education runs at 17.9% of all government spending (2025), and the most recent secondary enrolment figure is 52.4% gross, which dates from 2013 (UNESCO Institute for Statistics).
Made in Zimbabwe.
Cotton has long been a major smallholder crop, once nicknamed the country's white gold, and is still spun and woven locally. The Tonga and Binga communities of the Zambezi valley are known for tightly coiled baskets made from ilala palm and natural dyes, a living craft sold across the region, alongside sisal cordage, reed mats and traditional weaving. Every step of processing done at home is value that stops leaving the country.
What Zimbabwe actually sells the world
The single biggest thing Zimbabwe sells the world is pearls, gemstones and precious metals, 31.2% of all exports in 2023 (about US$2.25 billion, UN Comtrade). The next four are tobacco at 18.0%, nickel at 13.7%, salt, sulphur, stone and cement at 12.8%, ores, slag and ash at 10.2%.
Made now · natural materials
Once nicknamed the country's white gold
Worked in Zimbabwe from local material, and still a working craft rather than a museum piece.
Made now · natural materials
Handspun cotton
Worked in Zimbabwe from local material, and still a working craft rather than a museum piece.
Made now · natural materials
Woven locally. The Tonga
Worked in Zimbabwe from local material, and still a working craft rather than a museum piece.
Made now · natural materials
Natural dyes
Worked in Zimbabwe from local material, and still a working craft rather than a museum piece.
Made now · natural materials
Living craft sold across the region
Worked in Zimbabwe from local material, and still a working craft rather than a museum piece.
Buys in · 20.2% of imports
Mineral fuels and oils
Zimbabwe imported US$1.86 billion of mineral fuels and oils in 2023, 20.2% of everything it bought abroad, and sells none of it back. Every point of that is a business that could be built at home rather than shipped in. UN Comtrade.
Buys in · 13.2% of imports
Machinery and mechanical appliances
Zimbabwe imported US$1.22 billion of machinery and mechanical appliances in 2023, 13.2% of everything it bought abroad, and sells none of it back. Every point of that is a business that could be built at home rather than shipped in. UN Comtrade.
Buys in · 8.3% of imports
Vehicles
Zimbabwe imported US$0.77 billion of vehicles in 2023, 8.3% of everything it bought abroad, and sells none of it back. Every point of that is a business that could be built at home rather than shipped in. UN Comtrade.
Buys in · 6.4% of imports
Electrical machinery and electronics
Zimbabwe imported US$0.59 billion of electrical machinery and electronics in 2023, 6.4% of everything it bought abroad, and sells none of it back. Every point of that is a business that could be built at home rather than shipped in. UN Comtrade.
The maths for an entrepreneur. Zimbabwe produces about US$51 billion a year, which is roughly US$3,021 per person (2025, World Bank). Farming is 9.5% of that, while food is 19% of everything the country imports. The country buys in more food than its own farms contribute to the economy, and every point of that gap is a business someone could build here rather than ship in. With 10.4% of the land arable, the raw material for that is already in the ground.
The mbira dzavadzimu, a board of metal keys plucked with the thumbs, is the signature instrument of the Shona people and is played at the bira ceremony. UNESCO added the art of crafting and playing the mbira to its intangible heritage list in 2020.
Bira ceremony summoning ancestral spirits (vadzimu)
One of the most important ceremonies of traditional Shona religion. Mbira music goes on for several hours through the night to call an ancestral spirit into a medium, who then gives advice and guidance.
An ancient fertility dance of the Zezuru Shona in eastern Zimbabwe, especially Murewa and Uzumba-Maramba-Pfungwe, driven by one master drummer with no songs. UNESCO first proclaimed it in 2005 and inscribed it in 2008.
Chimurenga music
A popular music created by Thomas Mapfumo during the liberation war. It carries the sound of the mbira onto the electric guitar, with lyrics in Shona.
Sungura musicThe guitar dance music of the 1980s and 1990s, often called the authentic sound of Zimbabwe, which blends Congolese rumba with Zimbabwean jiti and Tanzanian kanindo.
Ndebele isitshikitshaA graceful Ndebele women's dance performed at weddings, bridal ceremonies and important community celebrations, with rhythmic footwork, sticks and animal tails.
Does Zimbabwe protect its heritage by law?
Partly, and the gaps say as much as the protections.
What is kept alive. Zimbabwe holds a profound living musical and spiritual heritage centred on the mbira dzavadzimu, the mbira of the ancestors. In the Bira ceremony, elders and spirit mediums play mbira and drums to invite the vadzimu, the ancestral spirits, into the community and to seek their guidance. The Jerusarema, or Mbende, dance of the Zezuru Shona was proclaimed a UNESCO Masterpiece of the Oral and Intangible Heritage of Humanity in 2005 and inscribed on the Representative List of the Intangible Cultural Heritage of Humanity in 2008, and it is still danced today, although UNESCO records that it is increasingly staged for tourist audiences and at political party rallies.
Who it belongs to. Zimbabwe's living Shona and Ndebele communities sustain rich traditions, from mbira music and Shona stone sculpture to the heritage of Great Zimbabwe. The country pioneered CAMPFIRE, the Communal Areas Management Programme for Indigenous Resources, a model that lets rural communities manage wildlife on their own land and receive tourism and related revenue. High-end safari tourism is often operator-led and the benefits have been uneven, but the community-conservation link is genuine and internationally cited.
Only here. Great Zimbabwe, Southern Africa's largest pre-colonial stone-built settlement and the country's namesake, a UNESCO World Heritage Site..
Three futures for Zimbabwe, every one run forward from measured data.
Where the making actually happens
Named cultural and craft sites on the open map: The Natural History Museum of Zimbabwe (Bulawayo), Bulawayo Railway Museum (Bulawayo), Zimbabwe Museum of Human Sciences (Harare), Museum of African liberation (Harare), The Mutare Museum (Mutare). OpenStreetMap. Named craft workshops on the open map: African Royal, Craft Center, Curio Market, Rokoteka Traders, Taku furnitures, Traitbeik trading.
Every measured trend on one line
Run forward at the pace already recorded.
-15%
Forest cover
1995: 41.8% → 2024: 35.7%
+199%
Renewable electricity
1995: 29.3% → 2021: 87.5%
-48%
CO2 per person
1995: 1.48 t → 2024: 0.77 t
-55%
Tourist arrivals
1995: 1,416k → 2020: 639k
+1%
Protected land
2013: 28.1% → 2025: 28.3%
+14%
Farm workforce
1995: 47.7% → 2025: 54.3%
+23%
Renewable energy use
1995: 67.1% → 2021: 82.4%
-45%
Energy per person
1995: 897 kg → 2024: 490 kg
+1%
Protected area, total
2013: 28.1% → 2025: 28.3%
+23%
Life expectancy
1995: 51.1 yrs → 2024: 63.1 yrs
+95%
Cereal yield
1995: 548 kg/ha → 2024: 1,070 kg/ha
-43%
Fertiliser use
1995: 46.1 kg/ha → 2024: 26.2 kg/ha
-13%
Rural population
1995: 68.6% → 2025: 59.5%
-29%
Water productivity
1995: 6.33 $/m3 → 2022: 4.48 $/m3
-72%
Health spending
2010: 10.5% → 2023: 2.93%
-15%
Forest area
1995: 161,868 km2 → 2025: 137,660 km2
-35%
Electric power use
1995: 856 kWh → 2024: 553 kWh
-5%
Emissions: Agriculture
1990: 12.7 MtCO2e → 2023: 12.1 MtCO2e
-31%
Emissions: Building
1990: 5.82 MtCO2e → 2023: 4 MtCO2e
-14%
Emissions: Electricity/Heat
1990: 7.01 MtCO2e → 2023: 6.03 MtCO2e
-18%
Emissions: Energy
1990: 21.9 MtCO2e → 2023: 17.9 MtCO2e
+138%
Emissions: Industrial Processes
1990: 0.55 MtCO2e → 2023: 1.31 MtCO2e
-10%
Emissions: Manufacturing/Construction
1990: 4.78 MtCO2e → 2023: 4.28 MtCO2e
+20%
Emissions: Transportation
1990: 2.16 MtCO2e → 2023: 2.59 MtCO2e
World Bank open data, recorded series
How much forest is left?
Forest cover moved from 41.8% to 35.7% across 29 recorded years.
World Bank, Forest area (% of land area) (AG.LND.FRST.ZS) https://data.worldbank.org/indicator/AG.LND.FRST.ZS?locations=ZW
How clean is the grid?
Renewable electricity moved from 29.3% to 87.5% across 26 recorded years.
World Bank, Renewable electricity output (% of total electricity output) (EG.ELC.RNEW.ZS) https://data.worldbank.org/indicator/EG.ELC.RNEW.ZS?locations=ZW
How much climate pollution per person?
CO2 per person moved from 1.48 t to 0.77 t across 29 recorded years.
World Bank, Carbon dioxide (CO2) emissions excluding LULUCF per capita (t CO2e/capita) (EN.GHG.CO2.PC.CE.AR5) https://data.worldbank.org/indicator/EN.GHG.CO2.PC.CE.AR5?locations=ZW
How many people visit?
Tourist arrivals moved from 1,416k to 639k across 25 recorded years.
World Bank, International tourism, number of arrivals (ST.INT.ARVL) https://data.worldbank.org/indicator/ST.INT.ARVL?locations=ZW
How much land is protected?
Protected land moved from 28.1% to 28.3% across 12 recorded years.
World Bank, Terrestrial protected areas (% of total land area) (ER.LND.PTLD.ZS) https://data.worldbank.org/indicator/ER.LND.PTLD.ZS?locations=ZW
How many people still farm?
Farm workforce moved from 47.7% to 54.3% across 30 recorded years.
World Bank, Employment in agriculture (% of total employment) (modeled ILO estimate) (SL.AGR.EMPL.ZS) https://data.worldbank.org/indicator/SL.AGR.EMPL.ZS?locations=ZW
What share of all energy is renewable?
Renewable energy use moved from 67.1% to 82.4% across 26 recorded years.
World Bank, Renewable energy consumption (% of total final energy consumption) (EG.FEC.RNEW.ZS) https://data.worldbank.org/indicator/EG.FEC.RNEW.ZS?locations=ZW
How much energy does one person use?
Energy per person moved from 897 kg to 490 kg across 29 recorded years.
World Bank, Energy use (kg of oil equivalent per capita) (EG.USE.PCAP.KG.OE) https://data.worldbank.org/indicator/EG.USE.PCAP.KG.OE?locations=ZW
How much land and sea is protected together?
Protected area, total moved from 28.1% to 28.3% across 12 recorded years.
World Bank, Terrestrial and marine protected areas (% of total territorial area) (ER.PTD.TOTL.ZS) https://data.worldbank.org/indicator/ER.PTD.TOTL.ZS?locations=ZW
How long do people live?
Life expectancy moved from 51.1 yrs to 63.1 yrs across 29 recorded years.
World Bank, Life expectancy at birth, total (years) (SP.DYN.LE00.IN) https://data.worldbank.org/indicator/SP.DYN.LE00.IN?locations=ZW
How much does a hectare of cereal produce?
Cereal yield moved from 548 kg/ha to 1,070 kg/ha across 29 recorded years.
World Bank, Cereal yield (kg per hectare) (AG.YLD.CREL.KG) https://data.worldbank.org/indicator/AG.YLD.CREL.KG?locations=ZW
How much fertiliser goes on the land?
Fertiliser use moved from 46.1 kg/ha to 26.2 kg/ha across 29 recorded years.
World Bank, Fertilizer consumption (kilograms per hectare of arable land) (AG.CON.FERT.ZS) https://data.worldbank.org/indicator/AG.CON.FERT.ZS?locations=ZW
How many people still live rurally?
Rural population moved from 68.6% to 59.5% across 30 recorded years.
World Bank, Rural population (% of total population) (SP.RUR.TOTL.ZS) https://data.worldbank.org/indicator/SP.RUR.TOTL.ZS?locations=ZW
How much value per cubic metre of water?
Water productivity moved from 6.33 $/m3 to 4.48 $/m3 across 27 recorded years.
World Bank, Water productivity, total (constant 2015 US$ GDP per cubic meter of total freshwater withdrawal) (ER.GDP.FWTL.M3.KD) https://data.worldbank.org/indicator/ER.GDP.FWTL.M3.KD?locations=ZW
How much goes on health?
Health spending moved from 10.5% to 2.93% across 13 recorded years.
World Bank, Current health expenditure (% of GDP) (SH.XPD.CHEX.GD.ZS) https://data.worldbank.org/indicator/SH.XPD.CHEX.GD.ZS?locations=ZW
How much forest is there in total?
Forest area moved from 161,868 km2 to 137,660 km2 across 30 recorded years.
World Bank, Forest area (sq. km) (AG.LND.FRST.K2) https://data.worldbank.org/indicator/AG.LND.FRST.K2?locations=ZW
How much electricity per person?
Electric power use moved from 856 kWh to 553 kWh across 29 recorded years.
World Bank, Electric power consumption (kWh per capita) (EG.USE.ELEC.KH.PC) https://data.worldbank.org/indicator/EG.USE.ELEC.KH.PC?locations=ZW
How have agriculture emissions moved?
Agriculture emissions moved from 12.68 to 12.1 MtCO2e across 33 recorded years.
Climate Watch (WRI), historical emissions
How have building emissions moved?
Building emissions moved from 5.82 to 4.0 MtCO2e across 33 recorded years.
Climate Watch (WRI), historical emissions
How have electricity/heat emissions moved?
Electricity/Heat emissions moved from 7.01 to 6.03 MtCO2e across 33 recorded years.
Climate Watch (WRI), historical emissions
How have energy emissions moved?
Energy emissions moved from 21.93 to 17.94 MtCO2e across 33 recorded years.
Climate Watch (WRI), historical emissions
How have industrial processes emissions moved?
Industrial Processes emissions moved from 0.55 to 1.31 MtCO2e across 33 recorded years.
Climate Watch (WRI), historical emissions
How have manufacturing/construction emissions moved?
Manufacturing/Construction emissions moved from 4.78 to 4.28 MtCO2e across 33 recorded years.
Climate Watch (WRI), historical emissions
How have transportation emissions moved?
Transportation emissions moved from 2.16 to 2.59 MtCO2e across 33 recorded years.
Climate Watch (WRI), historical emissions
Worst caseCurrent pathBest case
Worst case
Every measured decline continues at the pace already recorded. The weakest pillar, water at 1/5, is the one that gives way first.
Computed from: recorded series extended with no policy change
Current path
Every line above is a recorded World Bank series for this country. The current path is simply those series continuing at the pace already measured.
Computed from: recorded series, no policy change assumed
Best case
The pledges are met on their own stated timetables and the weakest pillars are lifted to match the strongest. Zimbabwe already shows it can do this: culture scores 5/5.
Computed from: each published target delivered on its own date
What the best case actually asks for
Lift water
It scores 1 out of 5 today, among the weakest parts of Zimbabwe's record. Zimbabwe sits on real freshwater assets: the Zambezi forms its northern border and feeds Lake Kariba, the largest reservoir in the world by volume, while the Limpopo, Save and Manyame rivers and a network of dams serve the interior.
measured each year
Costs: spending and enforcement, not new technology
Lift organic farming
It scores 1 out of 5 today, among the weakest parts of Zimbabwe's record. Certified organic farming is negligible, at about 0.01% of agricultural land, roughly 1,043 hectares (FiBL, 2020).
measured each year
Costs: spending and enforcement, not new technology
Lift food and farming
It scores 2 out of 5 today, among the weakest parts of Zimbabwe's record. Agriculture underpins the economy and employs a large share of the rural population, producing maize, tobacco (a leading export), cotton, sugar, groundnuts and cattle.
measured each year
Costs: spending and enforcement, not new technology
Government and Goals in Zimbabwe.
Who is in charge of Zimbabwe now · Office-holders from the UN Protocol and Liaison Service public list of Heads of State and Heads of Government, 20 October 2026. Legislature and election dates from IFES ElectionGuide. Constitution dates from the Constitute Project. Governance scores from the World Bank Worldwide Governance Indicators 2024.
Emmerson Mnangagwa
President
Emmerson Mnangagwa is the head of government of Zimbabwe, in office since 4 September 2023. Every climate, protection and energy pledge on this page is delivered, or not, under this administration.
Public opinion, measured
Voice and accountability, the freedom to question government scores 33.9 out of 100 in 2025. On this World Bank scale, 100 is the strongest governance measured. Down from 34.8 in 2024. World Bank Worldwide Governance Indicators, 2025 data (updated 25 September 2026) https://www.worldbank.org/en/publication/worldwide-governance-indicators
Control of corruption scores 22.0 out of 100 in 2025. On this World Bank scale, 100 is the strongest governance measured. Down from 22.4 in 2024. World Bank Worldwide Governance Indicators, 2025 data (updated 25 September 2026) https://www.worldbank.org/en/publication/worldwide-governance-indicators
Political stability and absence of violence scores 50.3 out of 100 in 2025. On this World Bank scale, 100 is the strongest governance measured. Up from 49.3 in 2024. World Bank Worldwide Governance Indicators, 2025 data (updated 25 September 2026) https://www.worldbank.org/en/publication/worldwide-governance-indicators
Rule of law scores 38.6 out of 100 in 2025. On this World Bank scale, 100 is the strongest governance measured. Up from 38.4 in 2024. World Bank Worldwide Governance Indicators, 2025 data (updated 25 September 2026) https://www.worldbank.org/en/publication/worldwide-governance-indicators
Regulatory quality scores 33.5 out of 100 in 2025. On this World Bank scale, 100 is the strongest governance measured. Down from 34.3 in 2024. World Bank Worldwide Governance Indicators, 2025 data (updated 25 September 2026) https://www.worldbank.org/en/publication/worldwide-governance-indicators
Emmerson MnangagwaPresident
ParliamentLegislature, bicameral
Last election23 August 2023
Constitution2013, as revised to 2021
Government typepresidential republic
Zimbabwe national goals: what has been pledged, and how far it has got · each pledge measured against this country's own recorded delivery
2030
30% of land protected
! close
Target 3 of the Kunming-Montreal Global Biodiversity Framework, adopted by more than 190 parties in December 2022. Zimbabwe currently protects 28.3% of its land, which is 94% of the way to the pledge. ↗
2030
Paris Agreement pledge
on record
Zimbabwe has a Nationally Determined Contribution lodged with the UNFCCC. The registry holds the current text, its target year and the sectors it covers. ↗
Plastic policy
in force
Expanded polystyrene (kaylite) food containers prohibited under Statutory Instrument 84 of 2012, enforced from July 2017; plastic packaging must be at least thirty micrometres thick under Statutory Instrument 98 of 2010..
Grid, as it stands
53% renewable
Recorded renewable share of electricity output, the number every energy pledge is measured against. ↗
Plain Answers About Zimbabwe.
The questions people actually type, answered in full sentences from the sourced data above.
swipe →
Is Zimbabwe sustainable?
Zimbabwe scores 62 out of 100 on the Throne Eco Index, across twelve equally weighted pillars. A landlocked southern-African country of vast miombo woodlands, one of the continent's largest elephant populations and the pioneering CAMPFIRE model of community-run wildlife conservation.
Is the water in Zimbabwe safe and plentiful?
Zimbabwe sits on real freshwater assets: the Zambezi forms its northern border and feeds Lake Kariba, the largest reservoir in the world by volume, while the Limpopo, Save and Manyame rivers and a network of dams serve the interior. Despite this, only about 25% of the population has safely managed drinking water (WHO/UNICEF JMP, 2024), and recurrent droughts, including the severe 2024 El Nino drought that was declared a national disaster, expose the drier south. Urban supply is fragile, with Harare's overstretched treatment works and periodic cholera and typhoid outbreaks a recurring problem.
Can Zimbabwe feed itself?
Agriculture underpins the economy and employs a large share of the rural population, producing maize, tobacco (a leading export), cotton, sugar, groundnuts and cattle. Food imports run at roughly 19% of merchandise imports (World Bank, 2024), reflecting a country that is normally close to self-sufficient in its staple maize. That balance is fragile, however, as drought years such as 2024 force large grain imports and leave millions needing food assistance.
Is it easy to eat plant-based in Zimbabwe?
The everyday diet is built on sadza, a stiff porridge of maize meal and increasingly of small grains like millet and sorghum, eaten with muriwo, leafy greens such as covo and rape, plus groundnut relish (dovi), beans, pumpkins and sweet potatoes. Whole-food plant eating is the rural norm rather than a lifestyle choice, and meat is often an occasional addition. Indigenous foods such as baobab fruit and wild greens broaden an already plant-rich base.
How much of Zimbabwe is actually protected?
About 28% of Zimbabwe's land area is under protection (World Bank/UNEP-WCMC, 2025), a strong estate that includes Mana Pools National Park, a UNESCO World Heritage Site, along with Hwange, Gonarezhou and Matobo. The country anchors part of the Kavango-Zambezi Transfrontier Conservation Area, the largest such initiative in the world, and runs community conservancies alongside the state parks. Enforcement is stretched by underfunding and poaching, but the flagship reserves are genuinely managed rather than paper parks.
What wildlife is left in Zimbabwe?
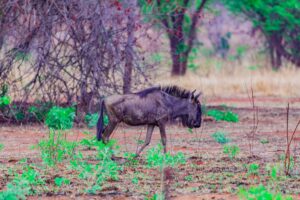
Zimbabwe holds one of Africa's largest elephant populations, second only to Botswana, together with the full Big Five, large hippo and crocodile numbers, and a significant population of endangered African wild dogs. Private conservancies such as Save Valley and Bubye Valley have become important refuges for black and white rhino and centres of active wildlife restoration. The Eastern Highlands add near-endemic birds such as Swynnerton's robin and Roberts's warbler along with their own endemic flora.
Is Zimbabwe on clean energy?
Zimbabwe's grid leans on two large stations, the Kariba hydropower dam and the Hwange coal plant, with hydropower supplying about 53 per cent of generation in 2023, coal around 26 per cent and imports much of the rest. Coal dominates installed capacity at roughly 57 per cent, and the country is expanding the Hwange coal units, which weighs against its clean profile. Even so, emissions per person are very low at around 0.77 tonnes of CO2 a year.
How polluted is Zimbabwe?
Zimbabwe prohibits expanded polystyrene (kaylite) food containers under Statutory Instrument 84 of 2012, a ban the Environmental Management Agency publicised and began enforcing in July 2017, and sets a minimum plastic packaging thickness of thirty micrometres under Statutory Instrument 98 of 2010, but enforcement is patchy and urban litter and illegal dumping are common. Ambient air is moderately polluted, with fine particulate matter (PM2.5) averaging around 22 micrograms per cubic metre, above the WHO guideline, driven by vehicle emissions, waste burning, and mining and industry.
Does recycling work in Zimbabwe?
Formal recycling rates are low. Harare recycles roughly 13.6% of its municipal solid waste, and the Environmental Management Agency estimates that only around 15% of plastic waste is recovered, most of it through informal waste-picking that has grown into a livelihood for many families. Kerbside collection and separation at source remain limited.
Is the farming in Zimbabwe organic?
Certified organic farming is negligible, at about 0.01% of agricultural land, roughly 1,043 hectares (FiBL, 2020). Much smallholder farming is low-input by necessity rather than by certification, and bodies such as the Zimbabwe Organic Producers and Promoters Association work to build the sector, but formal certified organic area remains tiny.
Are there natural materials and craft in Zimbabwe?
Cotton has long been a major smallholder crop, once nicknamed the country's white gold, and is still spun and woven locally. The Tonga and Binga communities of the Zambezi valley are known for tightly coiled baskets made from ilala palm and natural dyes, a living craft sold across the region, alongside sisal cordage, reed mats and traditional weaving.
Is there living culture in Zimbabwe?
Zimbabwe's living Shona and Ndebele communities sustain rich traditions, from mbira music and Shona stone sculpture to the heritage of Great Zimbabwe. The country pioneered CAMPFIRE, the Communal Areas Management Programme for Indigenous Resources, a model that lets rural communities manage wildlife on their own land and receive tourism and related revenue. High-end safari tourism is often operator-led and the benefits have been uneven, but the community-conservation link is genuine and internationally cited.
What heritage does Zimbabwe keep alive?
Zimbabwe holds a profound living musical and spiritual heritage centred on the mbira dzavadzimu, the mbira of the ancestors. In the Bira ceremony, elders and spirit mediums play mbira and drums to invite the vadzimu, the ancestral spirits, into the community and to seek their guidance. The Jerusarema, or Mbende, dance of the Zezuru Shona was proclaimed a UNESCO Masterpiece of the Oral and Intangible Heritage of Humanity in 2005 and inscribed on the Representative List of the Intangible Cultural Heritage of Humanity in 2008, and it is still danced today, although UNESCO records that it is increasingly staged for tourist audiences and at political party rallies.
So is Zimbabwe actually green? The measured answer
What is working: land protected at 28.3%, renewable electricity at 88.3%.
What is not: the gaps are narrower here than in most of the directory, and each remaining one is named below.
Zimbabwe sits 44 of 77 at 62/100. Every name links to its own destination page, built exactly like this one. The full ranking →
What is Zimbabwe particularly good at?
✓Culture, scored 5/5. Zimbabwe's living Shona and Ndebele communities sustain rich traditions, from mbira music and Shona stone sculpture to the heritage of Great Zimbabwe. The country pioneered CAMPFIRE, the Communal Areas Management Programme for Indigenous Resources, a model that lets rural communities manage wildlife on their own land and receive tourism and related revenue. High-end safari tourism is often operator-led and the benefits have been uneven, but the community-conservation link is genuine and internationally cited.
✓Heritage, scored 5/5. Zimbabwe holds a profound living musical and spiritual heritage centred on the mbira dzavadzimu, the mbira of the ancestors. In the Bira ceremony, elders and spirit mediums play mbira and drums to invite the vadzimu, the ancestral spirits, into the community and to seek their guidance. The Jerusarema, or Mbende, dance of the Zezuru Shona was proclaimed a UNESCO Masterpiece of the Oral and Intangible Heritage of Humanity in 2005 and inscribed on the Representative List of the Intangible Cultural Heritage of Humanity in 2008, and it is still danced today, although UNESCO records that it is increasingly staged for tourist audiences and at political party rallies. Chimurenga and sungura music, along with Ndebele dances such as isitshikitsha and amabhiza, keep the tradition broad and current. This is deep, widely alive heritage rooted in ancestral practice.
✓Plant-based eating, scored 4/5. The everyday diet is built on sadza, a stiff porridge of maize meal and increasingly of small grains like millet and sorghum, eaten with muriwo, leafy greens such as covo and rape, plus groundnut relish (dovi), beans, pumpkins and sweet potatoes. Whole-food plant eating is the rural norm rather than a lifestyle choice, and meat is often an occasional addition. Indigenous foods such as baobab fruit and wild greens broaden an already plant-rich base.
Where does Zimbabwe score worst?
✕Water, scored 1/5. Zimbabwe sits on real freshwater assets: the Zambezi forms its northern border and feeds Lake Kariba, the largest reservoir in the world by volume, while the Limpopo, Save and Manyame rivers and a network of dams serve the interior. Despite this, only about 25% of the population has safely managed drinking water (WHO/UNICEF JMP, 2024), and recurrent droughts, including the severe 2024 El Nino drought that was declared a national disaster, expose the drier south. Urban supply is fragile, with Harare's overstretched treatment works and periodic cholera and typhoid outbreaks a recurring problem.
✕Organic farming, scored 1/5. Certified organic farming is negligible, at about 0.01% of agricultural land, roughly 1,043 hectares (FiBL, 2020). Much smallholder farming is low-input by necessity rather than by certification, and bodies such as the Zimbabwe Organic Producers and Promoters Association work to build the sector, but formal certified organic area remains tiny.
✕Food and farming, scored 2/5. Agriculture underpins the economy and employs a large share of the rural population, producing maize, tobacco (a leading export), cotton, sugar, groundnuts and cattle. Food imports run at roughly 19% of merchandise imports (World Bank, 2024), reflecting a country that is normally close to self-sufficient in its staple maize. That balance is fragile, however, as drought years such as 2024 force large grain imports and leave millions needing food assistance.
Similar countries doing it better and worse
TanzaniaScored on the same twelve pillars as Zimbabwe.65
EthiopiaScored on the same twelve pillars as Zimbabwe.70
UgandaScored on the same twelve pillars as Zimbabwe.65
EgyptScored on the same twelve pillars as Zimbabwe.57
BotswanaScored on the same twelve pillars as Zimbabwe.53
SeychellesScored on the same twelve pillars as Zimbabwe.53
A note from the lens of mother natureswipe →
Water, 1/5
Zimbabwe sits on real freshwater assets: the Zambezi forms its northern border and feeds Lake Kariba, the largest reservoir in the world by volume, while the Limpopo, Save and Manyame rivers and a network of dams serve the interior.
Consequence: It is the lowest-scoring part of Zimbabwe's record, so it is where the score moves first.
Organic farming, 1/5
Certified organic farming is negligible, at about 0.01% of agricultural land, roughly 1,043 hectares (FiBL, 2020).
Food and farming, 2/5
Agriculture underpins the economy and employs a large share of the rural population, producing maize, tobacco (a leading export), cotton, sugar, groundnuts and cattle.
The Zimbabwe Directory.
Everything on My Ideal World that sits in Zimbabwe, checked and listed.
How the rest of the world scores Zimbabwe
Independent global indices, for calibration.
Forest cover
35.7
World Bank, 2024.
Protected land
28.3
World Bank, 2025.
Renewable grid
87.5
World Bank, 2021.
CO2 per person
~0.77
World Bank, 2024.
Threatened species
100
Recorded figure, sourced on this page.
Control of corruption
22.0 / 100
World Bank Worldwide Governance Indicators, 2025. Score from 0 to 100, where 100 is the strongest governance.
Government effectiveness
34.2 / 100
World Bank Worldwide Governance Indicators, 2025. Score from 0 to 100, where 100 is the strongest governance.
Rule of law
38.6 / 100
World Bank Worldwide Governance Indicators, 2025. Score from 0 to 100, where 100 is the strongest governance.
Political stability
50.3 / 100
World Bank Worldwide Governance Indicators, 2025. Score from 0 to 100, where 100 is the strongest governance.
Voice and accountability
33.9 / 100
World Bank Worldwide Governance Indicators, 2025. Score from 0 to 100, where 100 is the strongest governance.
Environmental Performance Index
46.1 / 100 · 59 of 177
Yale Environmental Performance Index 2026, ranked 59 of 177 countries assessed.
Ecosystem vitality
60.5 / 100 · 14 of 177
Yale Environmental Performance Index 2026, ranked 14 of 177 countries assessed.
Biodiversity and habitat
67.0 / 100 · 13 of 177
Yale Environmental Performance Index 2026, ranked 13 of 177 countries assessed.
Air quality
36.5 / 100 · 91 of 177
Yale Environmental Performance Index 2026, ranked 91 of 177 countries assessed.
Terrestrial biomes protected
94.0 / 100 · 25 of 177
Yale Environmental Performance Index 2026, ranked 25 of 177 countries assessed.
Where the numbers come from.
The institutions above are the ones cited on this page, ranked by how many of its figures they carry. This same sectioned page renders for all 77 scored destinations, each with its own researched history, comparison charts and three-way future. Read the full methodology
Every figure on this page, and where it came from: 100 sources across 35 institutions
IUCN Red List of Threatened Species checklist15 FIGURES
served by GBIF, Critically Endangered on the IUCN Red List, and recorded in Zimbabwe in GBIF occurrence data (mammal). check
Zimbabwe Parks and Wildlife Management Authority (ZimParks)13 FIGURES
World Elephant Day 2026 press release, Zimbabwe holds one of Africa's largest elephant populations, second only to Botswana, together with the full B check
World Elephant Day 2026 press release corroboration check
World Elephant Day 2026 press release corroboration check
World Elephant Day 2026 press release corroboration check
World Elephant Day 2026 press release corroboration check
World Elephant Day 2026 press release corroboration check
World Elephant Day 2026 press release corroboration check
World Elephant Day 2026 press release corroboration check
Lake Kariba Recreational Park, Zimbabwe sits on real freshwater assets: the Zambezi forms its northern border and feeds Lake Kariba, the larg check
Southern Region (Great Zimbabwe), Great Zimbabwe followed between the eleventh and fifteenth centuries, a stone city covering 722 hectares and o check
Southern Region (Great Zimbabwe) corroboration check
Southern Region (Great Zimbabwe) corroboration check
Southern Region (Great Zimbabwe) corroboration check
Other published sources5 FIGURES
Zimbabwe Sixth National Report to the Convention on Biological Diversity (2019), threatened species by group totalling 100, via UNEP-GRID Interactive Country Fiches check
0.4% of GDP removed: it is a single 2023 UIS outlier (after 6.14% in 2014) that cannot be reconciled with the same database's 17.9% government-spending share; enrolment now dated to 2013, the latest year UIS publishes check
UN Security Council resolution 216 (1965) of 12 November 1965, A white minority government declared independence unilaterally in 1965, a liberation war followed, and the cou check
UN Security Council resolution 216 (1965) of 12 November 1965 corroboration check
UN Security Council resolution 216 (1965) of 12 November 1965 corroboration check
IUCN4 FIGURES
'African elephant species now Endangered and Critically Endangered', 25 March 2021, Endangered on the IUCN Red List, and recorded in Zimbabwe in GBIF occurrence data (mammal). check
'African elephant species now Endangered and Critically Endangered', 25 March 2021 corroboration check
'African elephant species now Endangered and Critically Endangered', 25 March 2021 corroboration check
The IUCN Red List of Threatened Species, Critically Endangered, the last IUCN category before Extinct in the Wild, and still recorded in Zimbabwe. check
'Mbira dzavadzimu and its space within the Shona cosmology: tracing mbira from bira to the spiritual world', Muziki: Journal of Music Research in Africa (2011), Mbira dzavadzimu music and the Bira ceremony summoning ancestral spirits (vadzimu); Jerusarema/Mbende dance (U check
'Mbira dzavadzimu and its space within the Shona cosmology: tracing mbira from bira to the spiritual world', Muziki: Journal of Music Research in Africa (2011) corroboration check
'Mbira dzavadzimu and its space within the Shona cosmology: tracing mbira from bira to the spiritual world', Muziki: Journal of Music Research in Africa (2011) corroboration check
'Mbira dzavadzimu and its space within the Shona cosmology: tracing mbira from bira to the spiritual world', Muziki: Journal of Music Research in Africa (2011) corroboration check
FAO, Global Forest Resources Assessment3 FIGURES
UN SDG Global Database, forest area (% of land area) AG_LND_FRST, Zimbabwe, 2025 (35.6%), country-reported check
UN SDG Global Database, forest area under a long-term management plan (%) AG_LND_FRSTMGT, Zimbabwe, 2025 (21.5%), country-reported check
UN SDG Global Database, forest area inside legally established protected areas (%) AG_LND_FRSTPRCT, Zimbabwe, 2025 (21.5%), country-reported check
WHO/UNICEF Joint Monitoring Programme3 FIGURES
safely managed drinking water services (% of population) SH.H2O.SMDW.ZS, Zimbabwe, 2022 check
UN SDG Global Database, population using safely managed drinking water (%) SH_H2O_SAFE, Zimbabwe, 2024 (25.5%), modelled estimate check
UN SDG Global Database, population using safely managed sanitation (%) SH_SAN_SAFE, Zimbabwe, 2024 (23.6%), modelled estimate check
BirdLife International, IUCN and UNEP-WCMC2 FIGURES
UN SDG Global Database, terrestrial Key Biodiversity Areas covered by protected areas (%) ER_PTD_TERR, Zimbabwe, 2025 (85.1%), country-reported check
UN SDG Global Database, freshwater Key Biodiversity Areas covered by protected areas (%) ER_PTD_FRHWTR, Zimbabwe, 2025 (82.0%), country-reported check
FAO2 FIGURES
FAOSTAT Crops and Livestock Products (QCL), Africa bulk dataset, By tonnage, the largest crops grown in Zimbabwe are sugarcane, potatoes, maize, cabbages and wheat (FAO, FAOST check
FAOSTAT Crops and Livestock Products (QCL), Africa bulk dataset corroboration check
UN Office of the High Representative for LDCs2 FIGURES
LLDCs and SIDS, A landlocked southern-African country of vast miombo woodlands, one of the continent's largest elephant popula check
inscribed on the Representative List in 2008 (3.COM); UNESCO's own description names tourist performances and political rallies, not weddings or funerals check
UN Protocol and Liaison Service1 FIGURE
Heads of State, Heads of Government and Ministers for Foreign Affairs, public list dated 20 October 2026 check
UNEP Global E-waste Monitor1 FIGURE
UN SDG Global Database, electronic waste recycled (%) EN_EWT_RCYR, Zimbabwe, 2017 (0.75%), country-reported check


 TanzaniaScored on the same twelve pillars as Zimbabwe.65
 EthiopiaScored on the same twelve pillars as Zimbabwe.70
 UgandaScored on the same twelve pillars as Zimbabwe.65
 EgyptScored on the same twelve pillars as Zimbabwe.57
 BotswanaScored on the same twelve pillars as Zimbabwe.53
 SeychellesScored on the same twelve pillars as Zimbabwe.53